설명
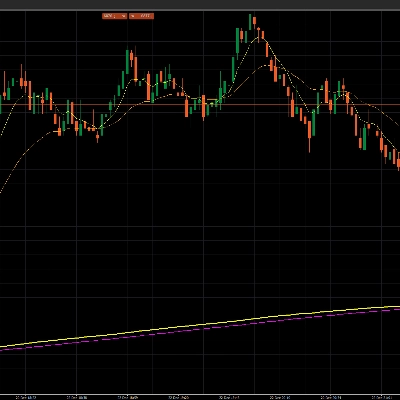
✅ VWAP (EMA) + MVWAP 평균선 — 메인 차트에 직접 표시됨
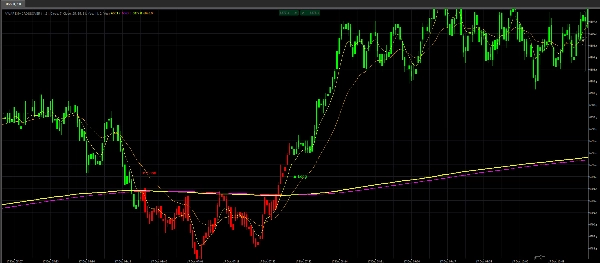
✅ 이중 EMA 크로스오버 엔진 (EMA1 + EMA2) — 명확한 추세 + 모멘텀 확인
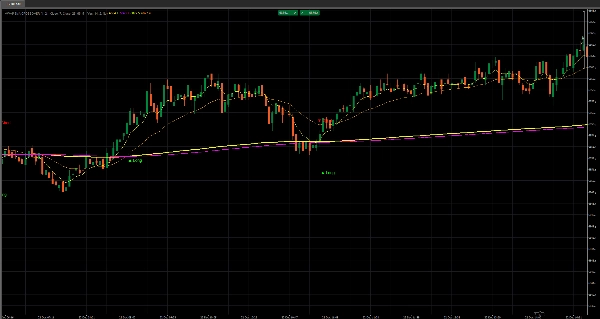
✅ 즉각적인 롱/숏 신호 차트 표시 — 정확한 위치에 라벨/화살표 출력
✅ 컬러 캔들 (녹색/빨간색) — 즉각적인 편향 + 체제 가시성, 망설임 없음
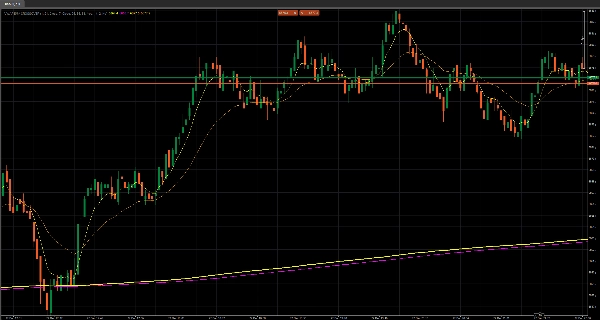
✅ 일일 세션 VWAP 리셋 — 매일 깨끗한 기관 기준선으로 시작
✅ 조정 가능한 신호 오프셋 + 텍스트 크기 — 어떤 타임프레임에서도 완벽하게 읽기 쉬움
✅ 깔끔한 오버레이 디자인 — 서브윈도우 혼잡 없음, 모든 결정은 차트에서
VWAP / MVWAP / EMA 크로스오버 — 오버레이 V2 는 한 가지 목적을 위해 만들어진 빠르고 직관적인 차트 도구입니다: 실시간으로 당신의 편향과 진입을 명확하게 만듭니다.
가장 중요한 결정 요소들을 가격 위에 직접 배치하여 — 패널에 숨겨두지 않고 — 눈을 행동에서 떼지 않게 합니다.
핵심 강점: 평균 대 모멘텀
이 지표는 두 가지 강력한 힘을 결합합니다:
- VWAP/MVWAP = 가격이 “있어야 할” 위치 (평균 / 공정 구역)
- EMA 크로스오버 = 모멘텀이 확정될 때 (변화 / 확인)
두 가지가 일치할 때, 추측이 아니라 구조화된 조건을 거래하는 것입니다.
컬러 캔들: “더 이상 혼란 없음” 기능
캔들 색상은 단순한 장식이 아니라 — 실시간 체제 필터입니다.
- 녹색 캔들 = 강세 체제 활성
- 빨간색 캔들 = 약세 체제 활성
이것은 차트를 신호등 시스템으로 바꿉니다: 즉시 롱 진입, 인내, 또는 거래 강제 중단 여부를 알 수 있습니다.
스캘핑과 빠른 의사결정에 있어, 이것은 게임 체인저입니다: 생각은 줄이고 실행은 늘리세요.
차트 내 신호: 깔끔하고, 타이밍 맞으며, 실행 가능
조건이 바뀌는 순간 롱 / 숏 마커가 차트에 출력됩니다.
즉:
- 변화를 일찍 포착하고,
- 늦은 진입을 피하며,
- 차트가 “말하려는 것”을 두 번 생각하지 않습니다.
신호는 조정 가능한 오프셋과 읽기 쉬운 크기로 배치되어, 복잡한 차트에서도 깔끔하게 유지됩니다.
세션 리셋 VWAP: 매일 새 기준선
VWAP 논리는 매일 리셋되어 일관된 세션 기준선을 제공합니다.
즉, 항상 현재의 의미 있는 기준점에 대해 가격을 읽는 것입니다 — 오래된 평균이 아닙니다.
트레이더들이 이 차트를 계속 사용하는 이유
왜냐하면 이 차트는 모든 차트가 필요로 하는 세 가지를 제공합니다:
- 편향 (컬러 캔들 + 평균선)
- 확인 (이중 EMA 크로스오버)
- 타이밍 (가격에 즉각적인 롱/숏 트리거)
무작위 캔들을 읽기 쉬운 시스템으로 바꾸는 깔끔한 오버레이를 원한다면 — 이것이 당신의 플러그 앤 플레이 실행 레이어입니다.


