AccountType Sample
Indicator
88 downloads
Version 1.0, Jan 2025
Windows, Mac
3.0
Reviews: 1
Description
sdcfd
Summary
AI summary
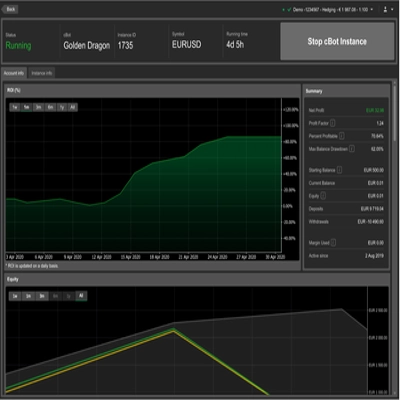
AccountType Sample is an indicator product designed for trading platforms. The available description and short summary provide minimal information, with no specific details on functionality, supported markets, or features. The product is categorized as an indicator and is associated with a single main item. No additional data on trading style, timeframe, risk parameters, or supported symbols is provided.
Indicator profile
Customer reviews
3.0
Reviews: 1
5 | 0 % | |
4 | 0 % | |
3 | 100 % | |
2 | 0 % | |
1 | 0 % |
Customer reviews
December 1, 2025
AccountType Sample is a small educational indicator showing how to read account info (type, balance, equity) via cTrader API. Not a trading tool, but a clean and useful reference for developers. Lightweight, stable, and ideal as a starting template.
Discussion
FAQ
Products available through cTrader Store, including trading bots, indicators and plugins, are provided by third-party developers and made available for informational and technical access purposes only. cTrader Store is not a broker and does not provide investment advice, personal recommendations or any guarantee of future performance.


!["[Stellar Strategies] Smart ADX" logo](https://cdn.ctrader.com/image/webp/af13b084-b6f6-41db-b7bc-c7e688b57b05_36929)


Price
Since 21/01/2025
88
Free installs