
Description
HA_ZigzagCycle_Main (メインチャート用)
日本語説明
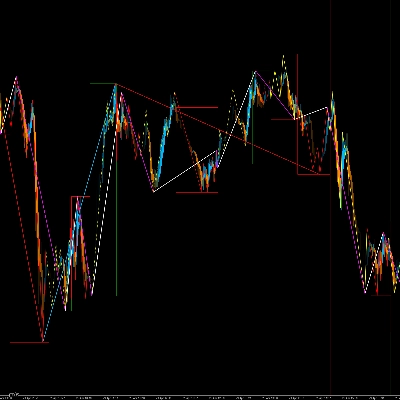
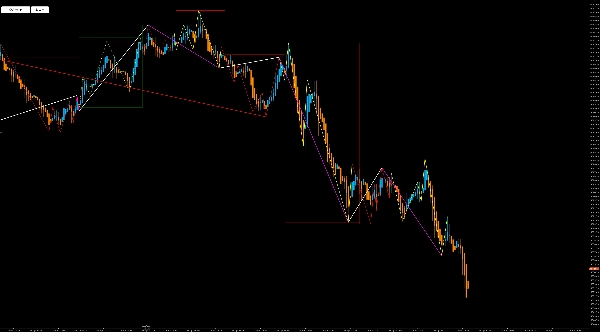
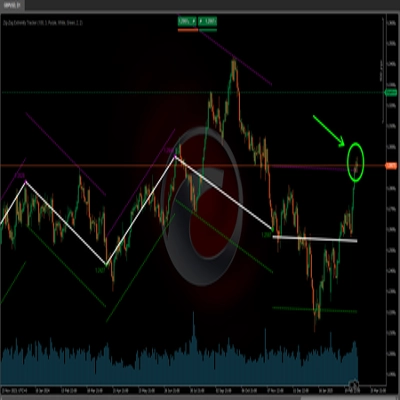
【製品概要】 HA_ZigzagCycle_Mainは、平均足の反転ロジックを利用して相場の「波」と「サイクル」を自動描画する、環境認識に特化したインジケーターです。単なるZigzagではなく、上昇・下降の波を定義し、6つの波が完結するまでを1つの「サイクル」として管理します。
【主な機能と動作原理】
- 波の検出: 平均足の陽線・陰線の連続性を基準に高値・安値を結び、Zigzagを描画します。
- サイクル理論: 6つの波(3つの上昇・下降ペア)が成立すると1サイクルとみなします。
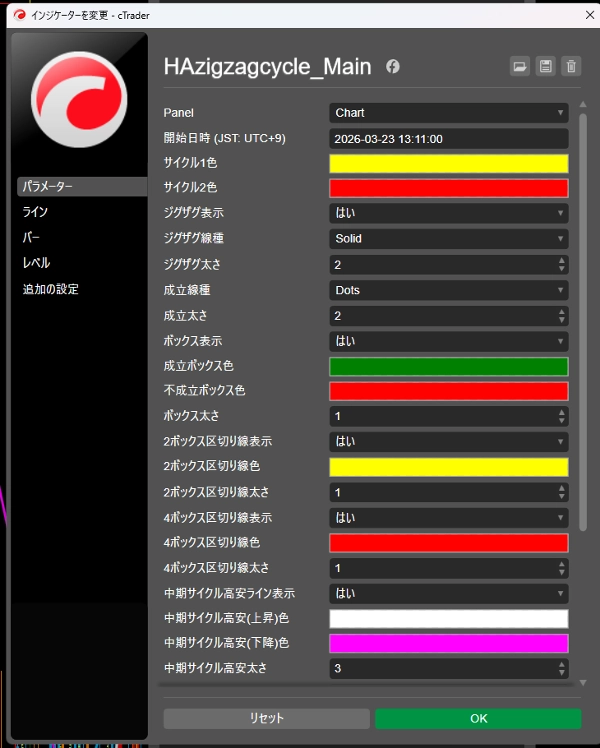
- 条件付きボックス表示: サイクルの最高値が起点となる安値を更新したかどうかに基づき、成功(Green)または失敗(Red)のボックスを表示し、トレンドの強弱を視覚化します。
- マルチサイクル・マクロライン:
- 中期サイクル: 現在の1サイクル(6波)ごとの高安。
- 長期サイクル: 2つのサイクルを統合した高安ライン。
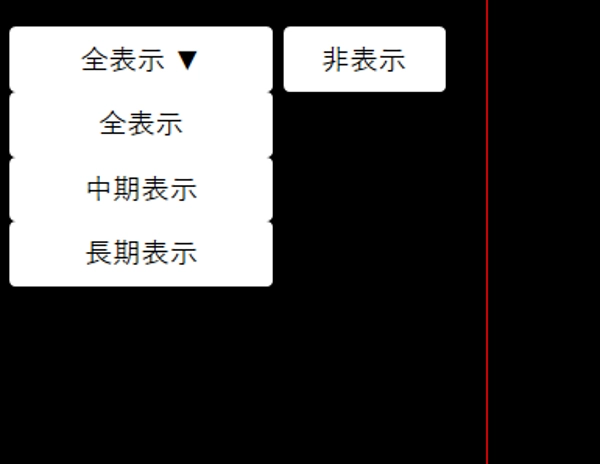
- インタラクティブ・コントロール: チャート上に配置された「表示切替ボタン」により、全表示・中期のみ・長期のみ・非表示をワンクリックで切り替え可能です。
【ユーザーが期待できること】
- トレンドの継続性や転換点を、主観を排除した「波の数」で判断できるようになります。
- フラクタル構造(中期・長期)の高安を自動で追跡するため、現在の価格がどのレベルのサイクルに位置しているかが一目でわかります。
ーーーーーーーーーーーーーーーーーーーーーーーーーーーーーーーーーーーーーーーーーーーーーーーーーーーーーーーーーー
English Description
[Product Overview] HA_ZigzagCycle_Main is a high-performance market structure indicator that automatically identifies "Waves" and "Cycles" using Heiken Ashi reversal logic. Unlike standard Zigzag indicators, it defines a complete "Cycle" as a sequence of six confirmed waves, providing a structured view of trend progression.
[Key Features & Principles]
- Wave Detection: Draws Zigzag lines based on the continuity of Heiken Ashi candles, filtering out market noise.
- Cycle Theory: Groups six consecutive waves into a single cycle.
- Success/Failure Visuals: Automatically draws Green (Success) or Red (Incomplete) boxes based on whether the cycle's peak broke the previous structural highs, helping you assess trend momentum.
- Multi-Cycle Macro Lines:
- Mid-term: Tracks highs/lows of the individual 6-wave cycle.
- Long-term: Tracks highs/lows across two combined cycles for a broader perspective.
- On-Chart Control Panel: Includes a retractable button menu to toggle visibility between "All," "Mid-term," "Long-term," or "Hidden" modes instantly.
[What Users Can Expect]
- Eliminate subjectivity in wave counting; follow a strict, rule-based approach to market structure.
- Identify fractal highs and lows automatically, allowing you to stay aligned with higher-timeframe trends while monitoring immediate price action.
Summary
Indicator profile
Discussion
Customer reviews
0.0
Reviews: 0
Customer reviews
No reviews for this product yet. Already tried it? Be the first to tell others!
FAQ
ADX
Bollinger Bands
Breaker Block
AI-assisted
Moving Average
VWAP
Support & Resistance
Products available through cTrader Store, including trading bots, indicators and plugins, are provided by third-party developers and made available for informational and technical access purposes only. cTrader Store is not a broker and does not provide investment advice, personal recommendations or any guarantee of future performance.








Price
Since 16/03/2026