Penerangan
Gambaran Indikator
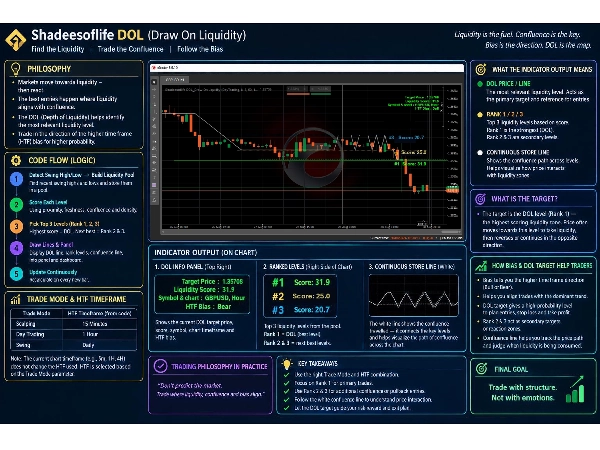
Penunjuk Shadeesoflife DOL (Draw on Liquidity) c Trader memberikan enjin pengenalan sasaran dinamik berdasarkan Konsep Wang Pintar (SMC) dan prinsip ICT. Ia secara automatik melukis Garis pada Kecairan (DOL), menilai, dan mengesan kolam kecairan struktur-"Konfluens tinggi" di seluruh pasaran pada setiap tik. DOL adalah sasaran dinamik, kecairan konfluens tinggi.
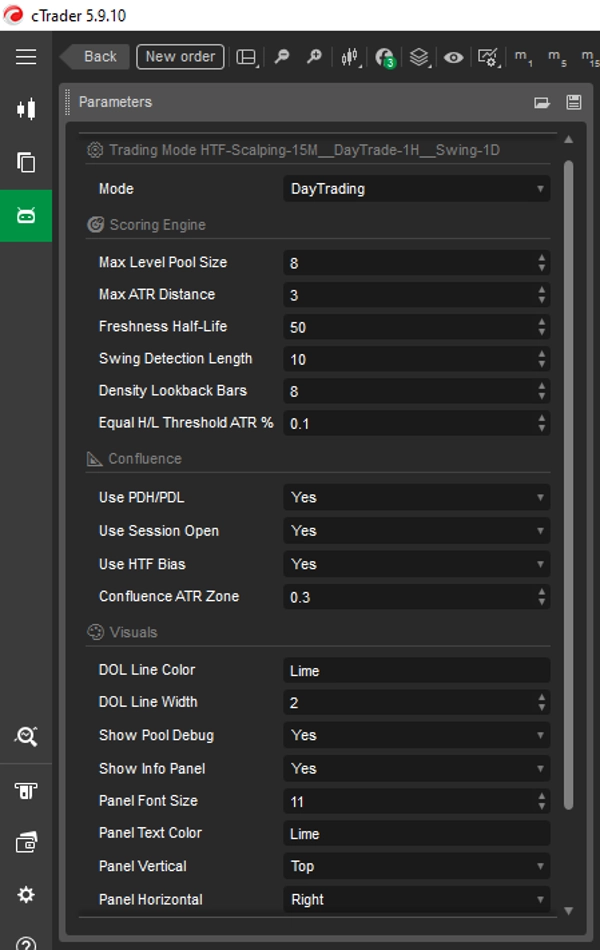
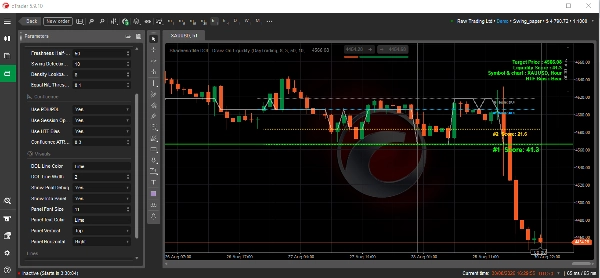
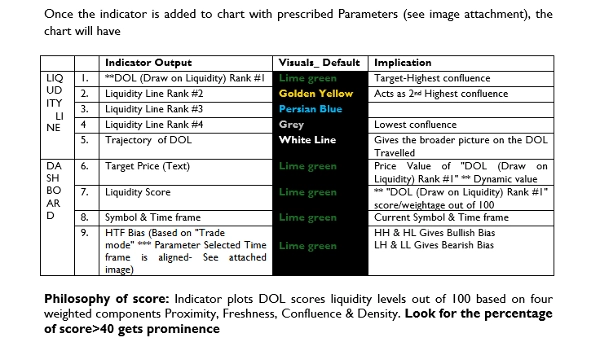
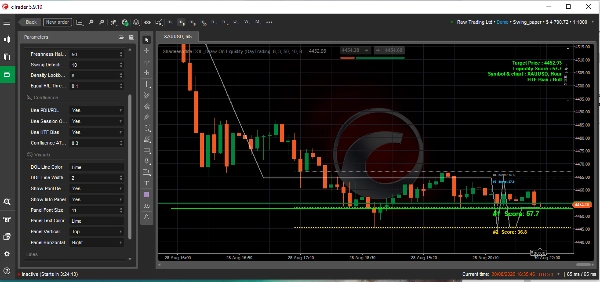
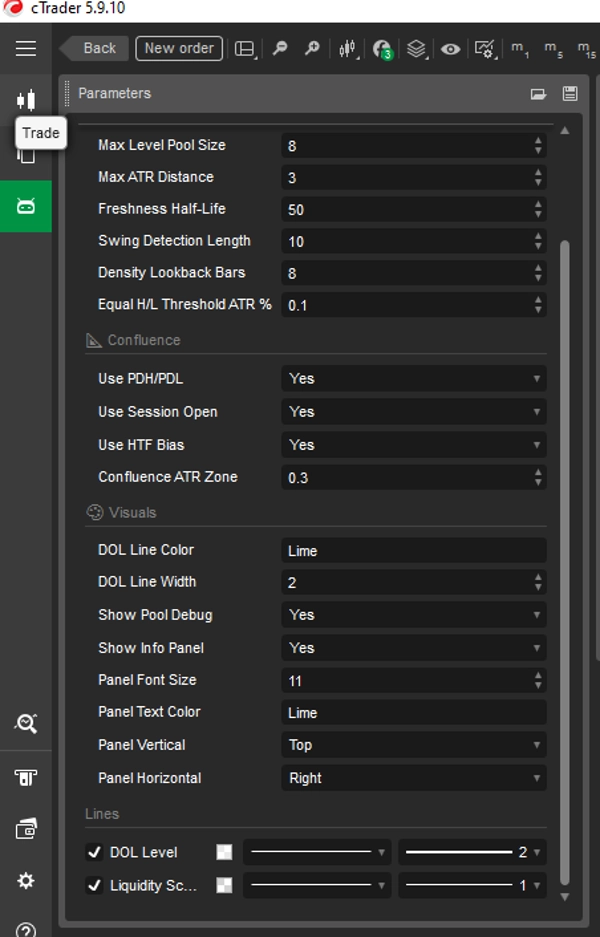
Penunjuk mengeluarkan sasaran utama DOL (tahap skor tertinggi, dipaparkan sebagai garis menonjol) bersama-sama kolam sasaran kecairan sekunder yang dinilai, sambil menyediakan panel di skrin yang menunjukkan bias HTF semasa dan metrik sasaran. Setelah penunjuk ditambah ke carta dengan Parameter yang ditetapkan (lihat lampiran imej), carta akan mempunyai
Untuk Jawapan- Rujuk imej yang dilampirkan (Jadual).
Falsafah skor: Penunjuk melakar skor DOL tahap kecairan daripada 100 berdasarkan empat komponen berwajaran Kedekatan, Kesegaran, Konfluens & Ketumpatan.
Soalan Lazim
1.Bagaimana ia berfungsi-Rangka Kerja Strategi Multi-Masa HTF & LTF??
Mengenal Pasti Bias dan Arah Masa Tinggi (HTF)
Penunjuk menentukan bias struktur menggunakan pilihan Mod Perdagangan asas untuk merujuk kepada jangka masa lebih tinggi (contohnya, ***Harian untuk Swing, 1-Jam untuk Perdagangan Harian, 15-Minit untuk Scalping):
- Bias HTF Bullish:
- Keadaan: Lilinnya HTF ditutup lebih tinggi daripada bukaannya (HTF Bullish).
- Perilaku Penunjuk: Enjin penilaian menunjukkan harga Sasaran (#1 garis skor bertanda) ditandakan di bawah harga Ask/bid (sasaran HTF menunjukkan kecairan dalaman dan harga sasaran LTF menunjukkan kecairan luaran).
- Implikasi Perdagangan: Harga mencari kecairan sisi jual (SSL) di bawah untuk retracement diskaun sebelum meneruskan ke atas, atau mensasarkan kecairan sisi beli (BSL) di atas sebagai sasaran pengembangan utama.
- Bias HTF Bearish:
- Keadaan: Lilinnya HTF ditutup lebih rendah daripada bukaannya (HTF Bear).
- Perilaku Penunjuk: Enjin penilaian menunjukkan harga Sasaran (#1 garis skor bertanda) ditandakan di atas harga Ask/bid (sasaran HTF menunjukkan kecairan dalaman dan harga sasaran LTF menunjukkan kecairan luaran).
- Implikasi Perdagangan: Harga mencari kecairan sisi beli (BSL) di atas untuk retracement premium sebelum bergerak ke bawah, atau mensasarkan kecairan sisi jual (SSL) di bawah.
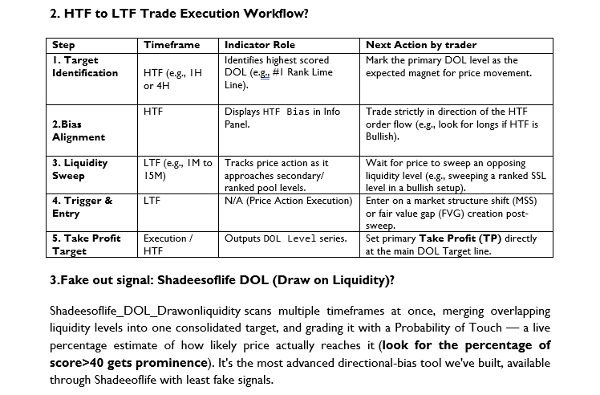
2. Aliran Kerja Pelaksanaan Perdagangan HTF ke LTF?
Untuk Jawapan- Rujuk imej yang dilampirkan (Jadual).
3.Isyarat Palsu: Shadeesoflife DOL (Draw on Liquidity)?
"Shadeesoflife DOL Draw on liquidity" mengimbas berbilang jangka masa sekaligus, menggabungkan tahap kecairan bertindih menjadi satu sasaran terkonsolidasi, dan menilainya dengan Kebarangkalian Sentuhan — anggaran peratusan langsung tentang betapa kemungkinan harga benar-benar mencapainya (cari peratusan skor>40 mendapat keutamaan). Ia alat bias arah paling maju yang kami bangunkan, tersedia melalui Shadeeoflife dengan isyarat palsu paling sedikit.
4. Bagaimana Konfluens dalam "Shadeesoflife DOL Draw on liquidity" teknikal berfungsi ?
"Shadeesoflife DOL Draw on liquidity" mengimbas Kecairan Dalaman, Kecairan Luaran, Blok Pesanan, Blok Pemecah, FVGs, iFVGs, dan BSL/SSL untuk bias arahnya. DOL Pro berjalan pada enjin yang berbeza sepenuhnya — ia mengimbas EQH/EQL, FVG besar, sempadan sesi, PDH/PDL, dan jurang malam/minggu merentas pelbagai jangka masa, membaca bias sesi seperti ayunan Judas dan kesinambungan, dan menilai sasaran dengan Kebarangkalian Sentuhan langsung, dengan algoritma yang lebih pintar. Misi bias arah yang sama seperti DOL, dibina pada enjin yang lebih ketat. Memberi hasil susunan kebarangkalian tinggi dengan menyediakan Arah dan sasaran Konfluens Lebih Tinggi harga.
Membaca pelbagai jangka masa sekali gus, bukan hanya satu, Mengimbas EQH/EQL, FVG besar, sempadan sesi, PDH/PDL, dan jurang malam/minggu. Membaca bias sesi — corak seperti ayunan Judas dan kesinambungan.
┌──────────────────────────────────────┐
│ KONSEP ICT / KEC AIRAN │
│ DOL • PDH • PDL • Sesi • HTF │
│ Kecairan • Tinggi/Sederhana Sama │
└──────────────────┬───────────────────┘
↓
┌──────────────────────────────────────┐
│ LAPISAN SMC / STRUKTUR │
│ Swing Tinggi • Swing Rendah │
│ Kolam Kecairan • Arah HTF │
└──────────────────┬───────────────────┘
↓
┌─────────────────────────────────────────┐
│ ENJIN KUANTUM SHADEESOFLIFE │
│ Kedekatan X% + Kesegaran Y% + Konfluens Z% + Ketumpatan A% │
│ │
│ → Skor 0–100 → Kedudukan #1/#2/#3 → DOL Dinamik │
└─────────────────────────────────────────┘
📊Pecahan Carta Teknikal (Tafsiran Imej dilampirkan)
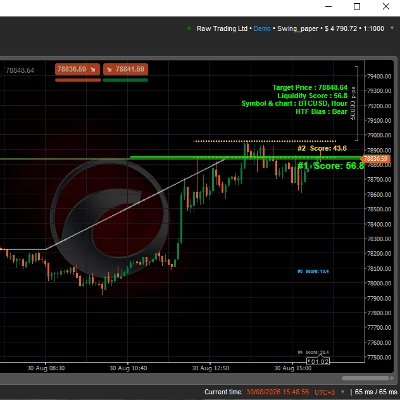
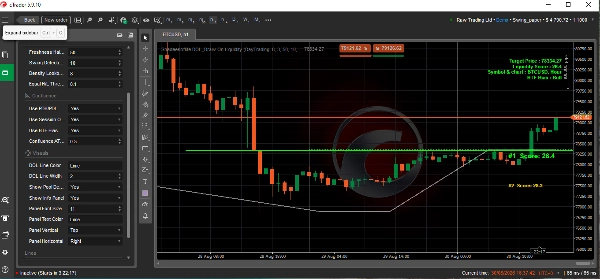
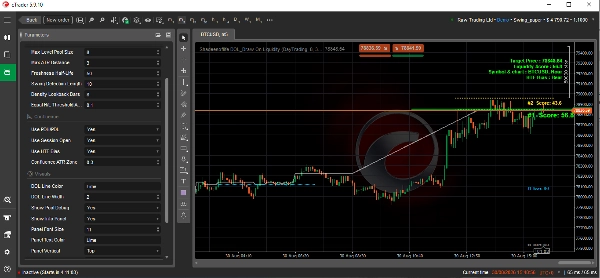
Carta ini dari Platform Perdagangan cTrader memaparkan BTCUSD (Bitcoin / Dolar AS) pada horizon masa 5-minit (m5). Ia menampilkan penunjuk struktur pasaran automatik tersuai yang dipanggil "Shadeesoflife DOL Draw On Liquidity", yang dikonfigurasikan menggunakan Konsep Wang Pintar (SMC).
🔎 Metrik Teknikal Utama & Analisis
- Harga Semasa: Aset sedang berdagang pada 78,856.48, berlegar ketat dalam julat kecairan tinggi yang sangat sempit.
- Harga Sasaran / Draw on Liquidity (DOL): Ditandakan oleh garis mendatar hijau terang pepejal pada 78,848.64. Ini berfungsi sebagai magnet menonjol untuk tindakan harga.
- Skor Kecairan (57.3): Skor sederhana menunjukkan pesanan institusi yang stabil tetapi tidak terlalu banyak di sekitar poket ini.
- Bias Masa Tinggi (HTF): Secara jelas dilabel sebagai Bearish (Bear). Sistem sedang mencari kesinambungan ke bawah setelah kecairan beli yang berehat dibersihkan.
- Skor Keutamaan Algoritma:
- #1 Skor (57.3): Terletak tepat di garis sasaran hijau.
- #2 Skor (45.8): Berehat sedikit lebih tinggi pada tahap garis asas merah.
💡 Tafsiran Strategik Teras
Penunjuk memetakan susunan SMC klasik di mana enjin pasaran mencari untuk menyapu kolam institusi tertentu.
- Kesan Magnet: Harga telah didorong ke atas ke zon premium dan kini sangat tertarik ke garis asas hijau Draw on Liquidity (DOL) pada 78,848.64.
- Penyesuaian Trend: Oleh kerana Bias HTF struktur adalah Bearish, tarikan ke bawah tempatan ke garis DOL ini selaras dengan trend dominan.
- Pembersihan Kecairan: Setelah harga menyasarkan dan mengurangkan kecairan yang berehat di garis hijau ini, pedagang biasanya menunggu pecahan struktur yang tegas atau kesinambungan agresif arah bearish makro.
Nota:
- Boleh digunakan dalam BTCUSD, XAUUSD, GBPUSD atau mana-mana simbol.
- Analisis BTCUSD di atas berdasarkan carta LTF 5m (pemilihan manual carta) dan HTF 1DAY (Parameter "Mod Perdagangan" untuk Perdagangan Harian dari pilihan lungsur).
- Penunjuk boleh digunakan untuk (parameter pilihan "Mod Perdagangan" diselaraskan dengan jangka masa untuk BIAS*)
- Scalping- HTF 15M, (Default)
- Perdagangan Harian- HTF 1H,
- Perdagangan Swing- HTF 1D,
- Perdagangan Empat Jam- HTF 4H
- Parameter "Tunjukkan debug kolam" boleh digunakan untuk mematikan garis konfluens sasaran yang kurang penting kecuali yang dinilai #1.
- Parameter "Tunjukkan panel info" boleh digunakan untuk mematikan untuk menyembunyikan panel.
- "Panel" boleh disesuaikan dengan saiz teks, warna teks & kedudukan panel (Posisi mendatar/menegak).
- Posisi garis "Tahap DOL" pada paksi X (Harga) menunjukkan garis konfluens Sasaran Kedudukan #1 pada paksi Y yang sepadan (Masa).
Ringkasan
The indicator outputs a primary Draw on Liquidity (DOL) target line representing the highest-scored liquidity level, along with secondary ranked targets. It provides an on-screen panel displaying higher timeframe (HTF) bias and target metrics, supporting trading styles from scalping to swing trading by referencing appropriate HTFs (e.g., 15-minute for scalping, daily for swing).
Shadeesoflife DOL integrates multi-timeframe analysis, scanning equal highs/lows, fair value gaps, session boundaries, previous day highs/lows, and gaps to assess directional bias and price magnet levels. It calculates a live Probability of Touch (PoT) percentage estimating the likelihood of price reaching each target.
Traders use the indicator to align trades with HTF bias, identify liquidity sweeps on lower timeframes, and set entries and take profit targets at ranked liquidity pools. It supports markets including BTCUSD and XAUUSD and offers customizable display options for target lines and info panels.