present
ลงทะเบียนและรับส่วนลด $50 สำหรับการซื้อครั้งแรกของคุณ
Trading product for FractalMS by SeekXow อินดิเคเตอร์ Key Levels MSS, image 1
FractalMS by SeekXow
อินดิเคเตอร์
เวอร์ชัน 1.0, Aug 2026
Windows, Mac
Trading product for FractalMS by SeekXow อินดิเคเตอร์ Key Levels MSS, image 2
Trading product for FractalMS by SeekXow อินดิเคเตอร์ Key Levels MSS, image 3
Trading product for FractalMS by SeekXow อินดิเคเตอร์ Key Levels MSS, image 4
ตั้งแต่ 09/12/2025
8.14M
ปริมาณการเทรด
16.34K
Pips ที่ได้กำไร

คำอธิบาย

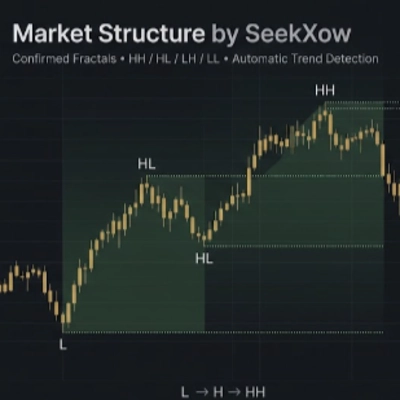
ตัวบ่งชี้ราคาแอคชันที่ออกแบบมาเพื่อระบุและแสดงโครงสร้างตลาดโดยใช้จุดหมุนแฟรคทัลที่ได้รับการยืนยัน ตัวบ่งชี้นี้ติดตามจุดสูงสุดและต่ำสุดของสวิงและจัดประเภทเป็น:

  • HH — Higher High
  • HL — Higher Low
  • LH — Lower High
  • LL — Lower Low

มันใช้จุดหมุนแฟรคทัลที่ได้รับการยืนยันเพื่อลดเสียงรบกวนและหลีกเลี่ยงการพึ่งพาการแกว่งราคาที่ไม่ได้รับการยืนยัน จุดหมุนต่อเนื่องของประเภทเดียวกันจะถูกบีบอัดเพื่อให้ค่าขีดสุดที่เกี่ยวข้องถูกเก็บไว้ก่อนที่จะประเมินโครงสร้างตลาด

คุณสมบัติหลัก

  • การตรวจจับสวิงที่ใช้แฟรคทัลที่ได้รับการยืนยัน
  • การจัดประเภท HH / HL / LH / LL อัตโนมัติ
  • การตรวจจับโครงสร้างตลาดขาขึ้นและขาลง
  • การระบุสถานะแนวโน้มโดยอัตโนมัติ
  • ระดับโครงสร้างแนวนอนที่มองเห็นได้
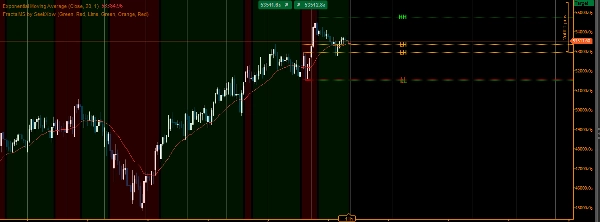
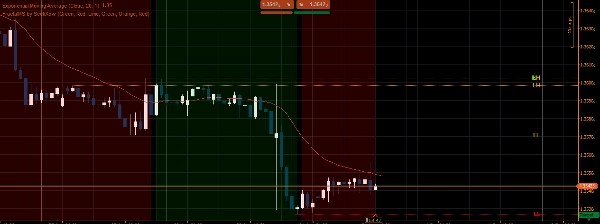
  • การแสดงภาพพื้นหลังแนวโน้ม
  • โครงสร้างปรับตัวเมื่อจุดหมุนที่ได้รับการยืนยันใหม่พัฒนา
  • ออกแบบมาสำหรับการวิเคราะห์ราคาแอคชันและโครงสร้างตลาดแบบเลือกใช้

วิธีการทำงาน

ตัวบ่งชี้จะตรวจจับจุดสูงสุดและต่ำสุดของสวิงที่ได้รับการยืนยันก่อน จากนั้นจุดหมุนเหล่านี้จะถูกประมวลผลเป็นลำดับสลับของจุดสูงและต่ำ ลำดับจุดหมุนที่ได้จะถูกใช้เพื่อกำหนดโครงสร้างตลาดและแนวโน้มปัจจุบัน ในช่วงแนวโน้มขาขึ้น จุดสูงสุดใหม่สามารถสร้าง Higher Highs ขณะที่จุดต่ำสุดที่เกี่ยวข้องกลายเป็น Higher Low ตรรกะตรงกันข้ามจะถูกใช้ในช่วงแนวโน้มขาลง การทะลุระดับโครงสร้างที่เกี่ยวข้องสามารถกระตุ้นการเปลี่ยนแปลงในแนวโน้มที่ตรวจพบได้

การใช้งานที่ตั้งใจไว้

ตัวบ่งชี้นี้สามารถใช้เป็นชั้นโครงสร้างตลาดควบคู่ไปกับราคาแอคชัน การสนับสนุน/ต้านทาน การวิเคราะห์สภาพคล่อง หรือเครื่องมือทางเทคนิคอื่นๆ เหมาะสำหรับเทรดเดอร์ที่ต้องการการแสดงภาพโครงสร้างสวิงที่ชัดเจนขึ้นในช่วงเวลาต่างๆ

หมายเหตุ: ตัวบ่งชี้นี้เป็นเครื่องมือวิเคราะห์ทางเทคนิคและไม่ได้ให้คำแนะนำทางการเงินหรือรับประกันผลลัพธ์การเทรด

สรุป

สรุปโดย AI
FractalMS by SeekXow is a price-action indicator that identifies and visualizes market structure using confirmed fractal pivots. It detects swing highs and lows and classifies them into four pivot types: Higher High (HH), Higher Low (HL), Lower High (LH), and Lower Low (LL). By relying on confirmed fractal pivots, the indicator reduces noise and avoids repainting, compressing consecutive pivots of the same type to retain relevant extremes before evaluating market structure.

Key features include automatic classification of pivot types, bullish and bearish market structure detection, trend-state identification, visual horizontal structure levels, and trend background visualization. The indicator continuously adapts as new confirmed pivots develop.

FractalMS works by detecting confirmed swing highs and lows, processing them into an alternating sequence to determine current market structure and trend. During uptrends, it identifies higher highs and higher lows; during downtrends, it identifies lower highs and lower lows. Breaking structural levels signals potential trend changes.

Designed for discretionary price-action and market-structure analysis, this tool supports traders seeking a clearer visual representation of swing structure across multiple timeframes. It complements other technical tools such as support/resistance and liquidity analysis.

โปรไฟล์อินดิเคเตอร์
หมวดหมู่อินดิเคเตอร์
โครงสร้างตลาด (SMC)
ประเภทเอาต์พุต
การแสดงเป็นภาพ
ข้อกำหนดด้านข้อมูล
แท่งเท่านั้น
สัญญาณที่รองรับ
Breakout
ความแข็งแกร่งของแนวโน้ม
เบรก Level ที่ระบุ
Reversal
แตะ Level ที่ระบุ

การสนทนา

รีวิวจากลูกค้า

0.0
รีวิว: 0
รีวิวจากลูกค้า
ยังไม่มีรีวิวสำหรับผลิตภัณฑ์นี้ หากเคยลองแล้ว ขอเชิญมาเป็นคนแรกที่บอกคนอื่น!

คำถามที่พบบ่อย

Key Levels
MSS
Market Structure
Support & Resistance
ผลิตภัณฑ์ที่มีให้บริการผ่าน cTrader Store รวมถึงบอทการเทรด อินดิเคเตอร์ และปลั๊กอิน มีให้บริการโดยนักพัฒนาบุคคลที่สามและมีไว้เพื่อวัตถุประสงค์ในการเข้าถึงข้อมูลและทางเทคนิคเท่านั้น cTrader Store ไม่ใช่โบรกเกอร์และไม่ได้ให้คำแนะนำการลงทุน คำแนะนำส่วนบุคคล หรือการรับประกันผลการดำเนินงานในอนาคต

เพิ่มเติมจากผู้เขียนคนนี้

cBot
Key Levels
Conservative
+5
XAUUSD market-structure cBot with dynamic risk, adaptive entries and automated trade management.
3.8
อัตราส่วน กำไรต่อขาดทุน

นอกจากนี้คุณยังอาจชอบ

อินดิเคเตอร์
SMC
Forex
+7
Simple Smart Money Concepts (SMC)
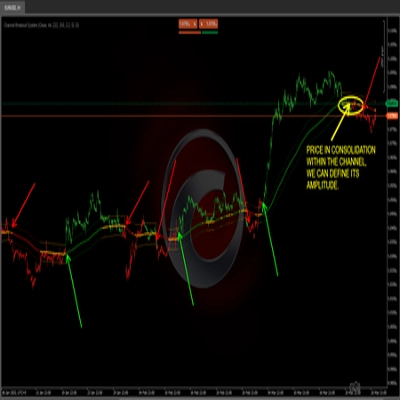
"Channel Breakout System" โลโก้
เรตติ้งสูง
4.2
(4)
$19
/
$30
อินดิเคเตอร์
ATR
RSI
+3
🚀 Specialized algorithm is designed to confirm entry and exit points with precision 🎯
อินดิเคเตอร์
ATR
Channel
+1
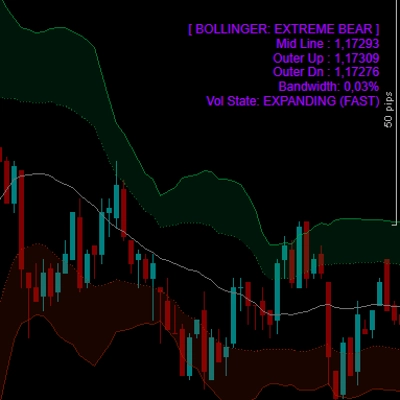
Bollinger Bands Advanced Squeeze & Breakout System, Real-Time On-Chart Dashboard, Auto-Squeeze Detector, Dual-Band Cloud
"UT Bot" โลโก้
ยอดนิยม
4.4
(5)
$19
/
$20
อินดิเคเตอร์
ATR
Forex
+11
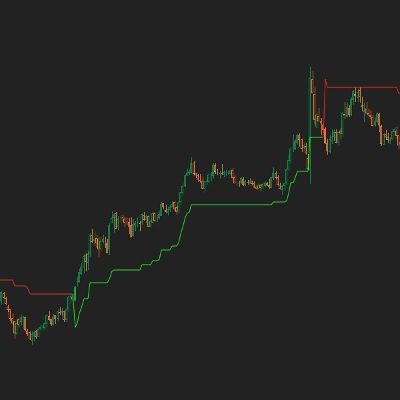
Trend-following indicator with dynamic ATR-based trailing stop for precise entry/exit signals
อินดิเคเตอร์
ATR
Forex
+11
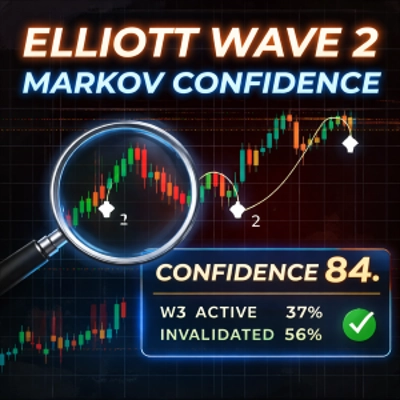
Elliott Wave 2 indicator with Markov probability analysis and a confidence score to assess Wave 3 continuation quality.
อินดิเคเตอร์
Prop
Forex
+13
Decision System Indicator According to Cosmic Laws
อินดิเคเตอร์
VWAP
Volume
+5
Multi VWAP. Three timeframes. One clean chart. Your Essential Trading Tool.
อินดิเคเตอร์
Forex
BTCUSD
+11
Catch High-Probability Reversals with Precision Swing
อินดิเคเตอร์
Forex
BTCUSD
+4
This indicator is designed to perform multiple non-linear regression analysis using four independent variables.
อินดิเคเตอร์
RSI
RSI on the main chart with 45/55 momentum levels, overbought/oversold levels, averaged RSI, and multi-timeframe support.
อินดิเคเตอร์
Forex
BTCUSD
+9
synchronize scroll position and zoom levels across multiple charts. Perfect for multi-timeframe analysis
อินดิเคเตอร์
BOS
EMA
+5
VWAP Bands indicator with 3 standard deviation levels, buy/sell zones, and a draggable ON/OFF button to toggle the entir
อินดิเคเตอร์
Prop
Forex
+5
Color Volume Bars – Visualize Market Strength Instantly
อินดิเคเตอร์
ATR
BOS
+5
Opening ranges, dynamic trend channels, and multi-scale breakout/retest analysis for clear intraday chart decisions.
อินดิเคเตอร์
Prop
Scalping
Shows bars from different Time Frame on zoom out and hides the current bars. Perfect tool for Multi TF "Market Reply"
อินดิเคเตอร์
Drawdown Monitor
Proprietary trading desk risk monitoring dashboard!
อินดิเคเตอร์
AI
SMC
+17
Smart Support/Resistance lines auto calculated from D1/H4/H1/M15. Highly customizable visuals + built in Backtest Mode.
อินดิเคเตอร์
The long awaited new and improved Supply Demand Premium V2 indicator. Unlock greater trading opportunities now!

ราคา

ตั้งแต่ 09/12/2025
8.14M
ปริมาณการเทรด
16.34K
Pips ที่ได้กำไร