
Opis
- Co robi (jego wartość).
- Jak pomaga traderom.
- Co czyni go wyjątkowym.
- Jak go używać (krótko).
- Co odblokuje wersja płatna (zajawka).
🔸
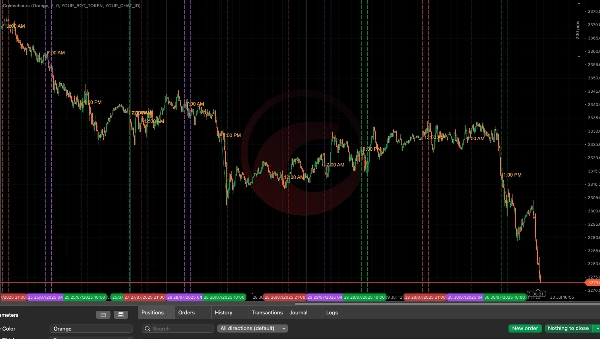
Wskaźnik Sesji Złotych Godzin
(Wersja darmowa)
Opis
Wskaźnik Sesji Złotych Godzin został zaprojektowany dla poważnych traderów, którzy chcą wizualizować okna handlowe o wysokim prawdopodobieństwie na podstawie wzorców płynności opartych na sesjach. To narzędzie automatycznie podświetla kluczowe okresy czasowe w sesjach Azji, Londynu i Nowego Jorku — często nazywane „złotymi godzinami” rynku — kiedy cena najprawdopodobniej wybije się z zakresu i ujawni intencje instytucjonalne.
Co robi:
- Śledzi maksima/minima sesji azjatyckiej (00:00–08:00 UTC) w celu mapowania stref płynności.
- Podkreśla kluczowe godziny Londynu i Nowego Jorku takie jak:
-
- Przedzamknięcie Londynu (06:00–07:00 UTC)
- Godzina zamknięcia Londynu (07:00–08:00 UTC)
- Strefa popołudniowego zmiatania NY (13:00–14:00 UTC)
- Rysuje wizualne wskazówki na twoim wykresie, aby skupić uwagę na codziennych godzinach wybicia.
Jak to pomaga Tobie:
- Łatwo zauważaj strefy zamiatania płynności podczas nakładania się sesji.
- Skupiaj swoje decyzje handlowe wokół ram czasowych smart money — koniec handlu w martwych strefach.
- Wizualnie rozpoznawaj miejsca, gdzie często występują fałszywe wybicia i odwrócenia.
- Działa na dowolnym instrumencie i dowolnym interwale czasowym podążającym za globalnymi cyklami sesji.
Kluczowe cechy:
- Regulowany kolor linii, grubość i rozszerzenia czasowe.
- Automatyczne śledzenie sesji bez ręcznego nanoszenia.
- Wbudowane wsparcie dla 15 ostatnich dni handlowych.
- Czyste, nieinwazyjne wizualizacje na wykresie.
Idealne dla:
- Traderów stylu ICT (modele płynności i timing)
- Skalperów price action
- Traderów korzystających z konfluencji czasowych
🔓 Chcesz więcej?
Wersja Pro (wkrótce dostępna) dodaje:
- Alerty o wybiciach w czasie rzeczywistym wysyłane bezpośrednio do Telegrama
- Logika dla fałszywych wybiciach Azji → odwrócenia Londynu i maksima/minima Londynu → odwrócenia NY
- Inteligentny timer chłodzenia, aby uniknąć nadmiernych alertów
- Pełne śledzenie maksimów/minimów sesji z etykietowaniem sygnałów
- Przyszła mapa drogowa: alerty FVG, wewnętrzne strefy płynności i filtrowanie sygnałów
Podsumowanie
Opinie klientów
5 | 0 % | |
4 | 100 % | |
3 | 0 % | |
2 | 0 % | |
1 | 0 % |


