present
Inscrivez-vous et bénéficiez d'une remise de 50 $ sur votre premier achat
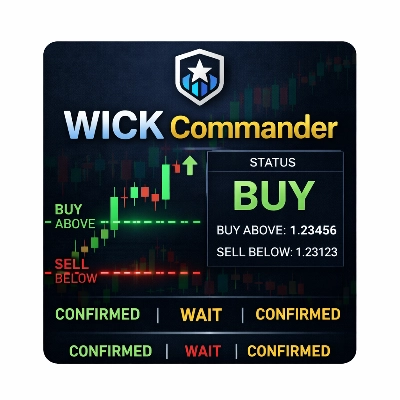
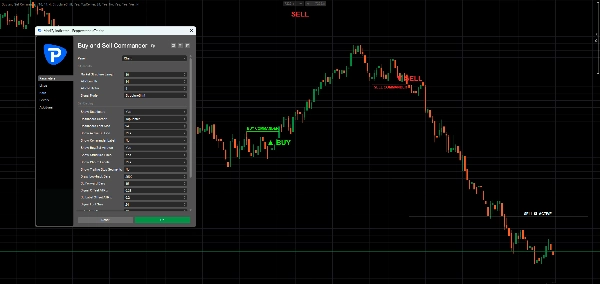
Trading product for Buy and Sell Commander Indicateur Aggressive Supertrend, image 1
Buy and Sell Commander
Indicateur
Version 1.0, May 2026
Windows, Mac
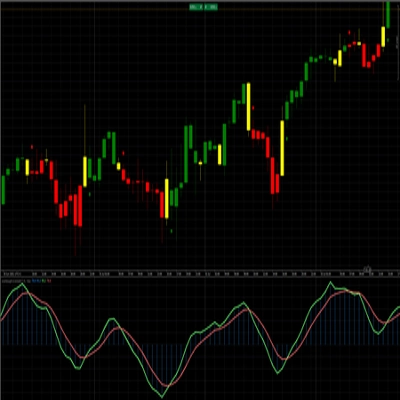
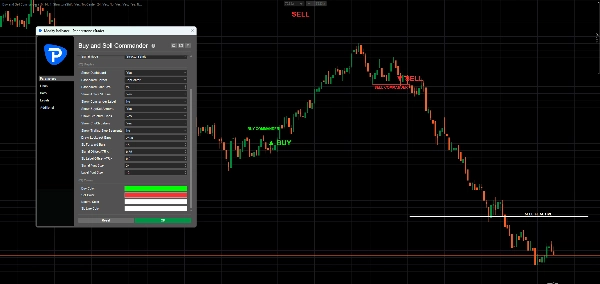
Trading product for Buy and Sell Commander Indicateur Aggressive Supertrend, image 2
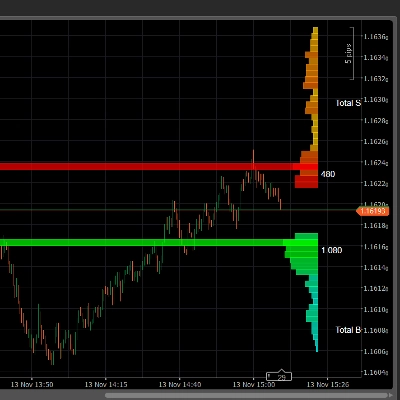
Trading product for Buy and Sell Commander Indicateur Aggressive Supertrend, image 3
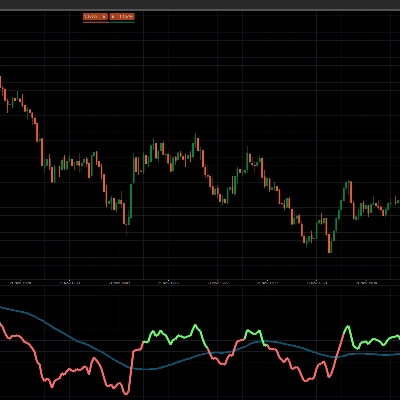
Trading product for Buy and Sell Commander Indicateur Aggressive Supertrend, image 4
86
Ventes
1.18K
Installations gratuites

Description

BUY & SELL Commander is designed to help traders quickly understand the current market direction without overcomplicating the chart.

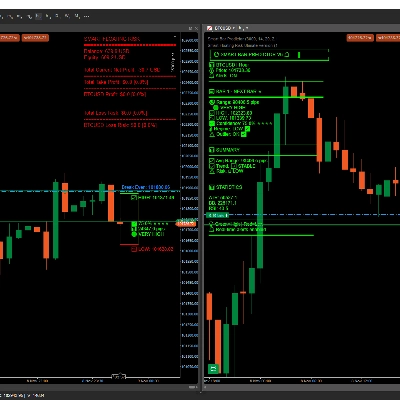
The indicator displays a simple dashboard at the top of the chart showing the active market status:

BUY
SELL
or
NEUTRAL

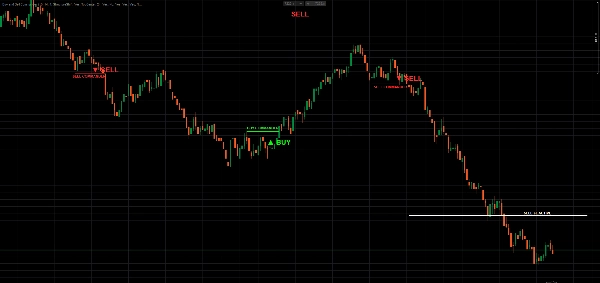
It also plots clear BUY and SELL signals directly on the chart and uses a white Active SL Line as a dynamic trend-flip level.

The goal of this indicator is simple:

to help traders see when buyers or sellers are currently in control.


How It Works

The indicator uses market structure and an ATR-based active stop line to determine the current trading direction.

In simple terms:

  • When the market is bullish, the dashboard shows BUY.
  • When the market is bearish, the dashboard shows SELL.
  • Before a valid signal appears, the dashboard shows NEUTRAL.

The white Active SL Line is the key part of the indicator.

When BUY is active, the white line normally follows below price.
When SELL is active, the white line normally follows above price.


Close Cross Active SL Mode

In CloseCrossActiveSL mode, the logic is very easy to understand.

When the indicator is in SELL mode, price must close above the white SELL SL ACTIVE line to trigger a new BUY signal.

When the indicator is in BUY mode, price must close below the white BUY SL ACTIVE line to trigger a new SELL signal.

So the basic logic is:

SELL active + candle closes above the Active SL Line = BUY signal

BUY active + candle closes below the Active SL Line = SELL signal

The indicator uses candle close confirmation, not only wick movement. This helps reduce false flips caused by temporary spikes.


What the Indicator Shows

Dashboard

A simple dashboard displays the current status:

  • BUY
  • SELL
  • NEUTRAL

This makes it easy to see the current direction at a glance.

BUY and SELL Signals

The indicator marks direction changes on the chart with clear signals:

  • ▲ BUY
  • ▼ SELL

Active SL Line

The white Active SL Line works as a dynamic trend-following stop line.

In BUY mode, the line follows below price.
In SELL mode, the line follows above price.

When price closes through this line, the market direction can change.


Main Features

  • Simple BUY / SELL / NEUTRAL dashboard
  • Clear BUY and SELL chart signals
  • ATR-based Active SL Line
  • Candle close confirmation
  • Market structure based signal detection
  • Optional CloseCrossActiveSL mode
  • Adjustable ATR settings
  • Adjustable dashboard position
  • Clean overlay display
  • Suitable for multiple timeframes and symbols


Recommended Use

BUY & SELL Commander can be used as:

  • a trend direction filter
  • a visual trailing stop guide
  • a trade confirmation tool
  • a market bias dashboard
  • a simple BUY / SELL decision support indicator

Example usage:

If the dashboard shows BUY, traders may focus mainly on buy opportunities.
If the dashboard shows SELL, traders may focus mainly on sell opportunities.
If the dashboard shows NEUTRAL, traders may wait for a valid signal.


Main Settings

Market Structure Length

Controls how sensitive the indicator is to market swings.

Lower values create faster signals.
Higher values create smoother and slower signals.

ATR Length

Controls the ATR calculation period.

ATR Multiplier

Controls the distance of the Active SL Line from price.

Lower values make the line tighter and more sensitive.
Higher values make the line wider and smoother.

Signal Mode

Choose between:

StructureShift
Uses market structure breaks to detect direction changes.

CloseCrossActiveSL
Uses candle close crosses of the Active SL Line to detect direction changes.

Dashboard Position

Choose where the BUY / SELL / NEUTRAL dashboard appears on the chart.


Simple Trading Logic

The indicator is built around one simple idea:

Trade with the active direction until price closes through the Active SL Line.

When BUY is active, the market bias remains bullish until price closes below the Active SL Line.

When SELL is active, the market bias remains bearish until price closes above the Active SL Line.


Important Note

This indicator does not guarantee profitable trades and should not be used as a standalone trading system. It is designed as a visual decision-support tool. Always combine it with your own strategy, risk management, and market analysis.


Disclaimer

Trading forex, indices, commodities, and other financial markets involves risk. Past performance does not guarantee future results. Use this indicator for analysis and educational purposes only.

Résumé

Profil de l'indicateur
Catégorie de l'indicateur
Tendance
Type de résultat
Signaux
Exigences en matière de données
Barres seulement
Données de tick
Signaux pris en charge
Croisement
Cassure
Inversion
Dépassement de niveau

Discussion

Avis clients

0.0
Avis : 0
Avis clients
Il n'y a pas encore d'avis sur ce produit. Vous l'avez déjà essayé ? Soyez le premier à en parler aux autres !

Questions fréquentes

Aggressive
Supertrend
Les produits disponibles sur cTrader Store, notamment les bots de trading, les indicateurs et les plug-ins, sont fournis par des développeurs tiers et mis à disposition à titre informatif et à des fins d'accès technique uniquement. cTrader Store n'est pas un courtier et ne fournit aucun conseil en investissement, aucune recommandation personnelle ni aucune garantie quant aux performances futures.

Plus de cet auteur

Indicateur
AI
ATR
+27
SR Commander is a clean and intelligent support and resistance indicator for cTrader, built to help traders identify key
Indicateur
AI
ATR
+20
Buy and Sell Signals
Indicateur
AI
ATR
+27
WICK COMMANDER — Know Exactly When the Market Commits
Indicateur
AI
ATR
+27
Overbought Oversold Indicator
Indicateur
AI
ATR
+20
Know Sure Thing (KST) momentum engine
Indicateur
AI
SMC
+5
Coloring trendline/ Colored Trendline / Color Trendline
Indicateur
AI
ATR
+27
VWAP Sniper Elite -- Institutional Trend Engine
Indicateur
AI
SMC
+13
Dynamic Liquidity Depth exposes hidden volume
Indicateur
AI
ATR
+26
Entry Momentum MACD Power Guide
Indicateur
AI
ATR
+27
The Professional “All-in-One” Trading Suite (buy and sell indicator)
Indicateur
AI
ATR
+26
SR Commander — Multi Timeframe Edition. See where the big money draws the line. Trade on your timeframe. Think on theirs
Logo de "crossover 1"
Les mieux notés
4.2
(5)
$19
/
$29
Indicateur
AI
Grid
+10
Crossover Buy and Sell Alerts and signals

Vous pourriez aussi aimer

Indicateur
EMA
RSI
+5
MACD Colour Histogram with 11 Moving Average Types, Multi-timeframe confirmation and Sound Signal Alert.
Logo de "Order Block"
Les mieux notés
4.8
(5)
$19
Indicateur
ATR
RSI
+7
Identify bullish and bearish Order Blocks to spot key support/resistance levels and potential trend reversals! 📈🔄
Indicateur
MACD
Forex
+2
a revolutionary indicator that integrates volume into MACD.
Indicateur
Doji
Wedge
+5
Angora Pattern Recognition is a cTrader indicator that finds, draws and tracks classic chart patterns automatically.
Indicateur
Key Levels
Liquidity Grab
+2
The levels you mark each morning, drawn and followed: PDH/PDL, weekly, monthly, sessions, equal highs/lows.
Indicateur
Volume
Imbalance
+5
Spot Institutional Order Flow with Proportional Volume Bubbles & Integrated Cumulative Volume Delta (CVD) Intelligence.
Indicateur
AI
ATR
+27
🔮 Smart Bar Predictor - Professional Volatility Forecasting Indicator
Logo de "SupertrendChannels"
Les mieux notés
4.7
(4)
$19
/
$20
Indicateur
Supertrend-based channel for entries, trailing stops, and dynamic support/resistance zones.
Indicateur
Forex
BTCUSD
+10
Trend-following channel using dual MAs with visual cloud and optional alerts on crossovers
Indicateur
Prop
Forex
+7
The Parabolic SAR, or "Stop and Reverse," is a dynamic technical analysis tool.
Indicateur
Forex
BTCUSD
+11
Auto-detects Bullish/Bearish Engulfing patterns to spot trend reversals. Real-time alerts, custom colors, all symbols.
Indicateur
VWAP
Volume
+5
Multi VWAP. Three timeframes. One clean chart. Your Essential Trading Tool.
Indicateur
Forex
GBPUSD
+5
Visual warning zones for high-impact news so you can manage risk before volatility hits.
Indicateur
ATR
Market Structure
+3
Support Resistance Toolkit
Indicateur
ATR
Volume
+3
Volume profile key levels - POC, value area, volume peaks and troughs - with break, rejection and retest signals
Indicateur
ATR
BOS
+5
Market structure with BOS and CHoCH, order blocks, and retest buy/sell arrows with entry, stop and two targets
Indicateur
ATR
RSI
+17
Turn data into precision trades with AlphaTrend Pro Max — advanced trend, signal & structure analysis in one.
Indicateur
SMC
Forex
+7
Simple Smart Money Concepts (SMC)

Prix

86
Ventes
1.18K
Installations gratuites