Deskripsi
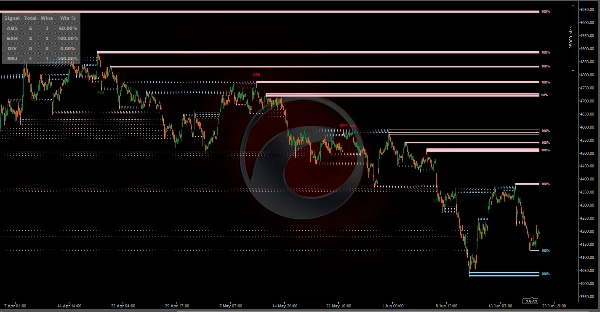
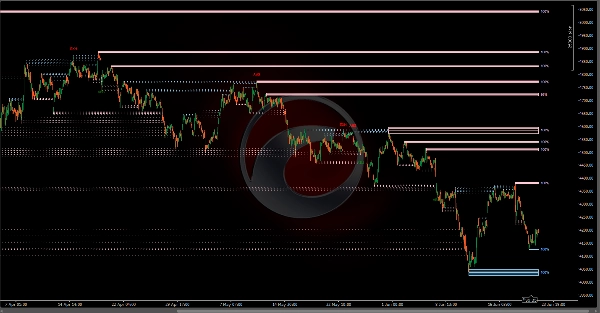
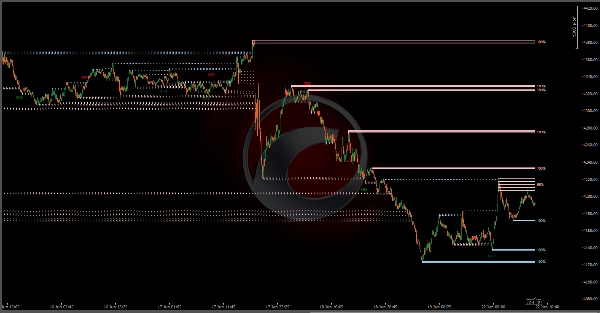
Alat Liquidity Profiler adalah indikator yang mengidentifikasi level likuiditas utama sisi pembeli dan sisi penjual serta memvisualisasikan aktivitas pembeli/penjual internal melalui kuadran berisi delta volume, menyediakan seperangkat alat lengkap untuk menganalisis sapuan likuiditas dan potensi pembalikan.
Deteksi
Indikator menggunakan sistem deteksi berbasis pivot. Ketika swing high dikonfirmasi, zona Likuiditas Sisi Beli (BSL) dibuat; swing low menciptakan zona Likuiditas Sisi Jual (SSL). Skrip ini menyertakan logika "Filter Overlaps" untuk memastikan kejelasan grafik. Jika pivot baru yang lebih signifikan terbentuk dalam rentang zona aktif yang sudah ada, alat ini dapat secara otomatis memperbarui ke level yang paling relevan, mencegah kekacauan dari banyak kotak yang tumpang tindih.
Alat ini membagi setiap zona menjadi empat kuadran horizontal. Saat harga bergerak dalam kuadran-kuadran ini, skrip menghitung delta volume (perbedaan antara tekanan beli dan jual) untuk setiap bagian spesifik.
Zona Beli: Menunjukkan pembeli agresif lebih aktif di irisan harga tertentu tersebut.
Zona Jual: Menunjukkan penjual agresif mendominasi bagian tersebut.
Deteksi Pembalikan
Skrip ini menyertakan sistem deteksi yang mengidentifikasi pola volume tidak biasa selama sapuan likuiditas. Sinyal ini ditampilkan sebagai teks sebagai berikut:
-
- ABS (Absorpsi): Terjadi ketika order pasar agresif di tepi ekstrem zona diserap oleh order limit besar di arah berlawanan.
- EXH (Kelelahan): Terjadi ketika sapuan terjadi pada volume relatif sangat rendah, menunjukkan tidak ada kelanjutan.
- DIV (Divergensi): Diidentifikasi ketika volume tinggi mendorong ke tepi zona (FOMO) tetapi harga gagal menutup di luar level tersebut.
- REJ (Penolakan Snapback): Dipicu ketika candle sapuan menunjukkan delta tinggi di arah berlawanan sapuan dan menutup kembali di dalam zona.
Dashboard:
Indikator ini menyertakan dashboard waktu nyata yang melacak kinerja historis dari setiap tipe sinyal pembalikan menggunakan logika validasi berbasis waktu.
Menang tercatat jika dalam Jendela Evaluasi, harga berbalik dari sapuan dan tetap dalam keuntungan (di sisi yang benar dari entri sinyal) selama sejumlah bar berturut-turut tertentu (Waktu Tahan).
Peluruhan Zona (Kesehatan):
Zona aktif menampilkan label persentase "Kesehatan". Ini melacak volume kumulatif yang diperdagangkan dalam zona relatif terhadap kapasitasnya. Saat lebih banyak volume diproses pada level ini, likuiditas dianggap "terkonsumsi," dan persentase menurun menuju 0%.
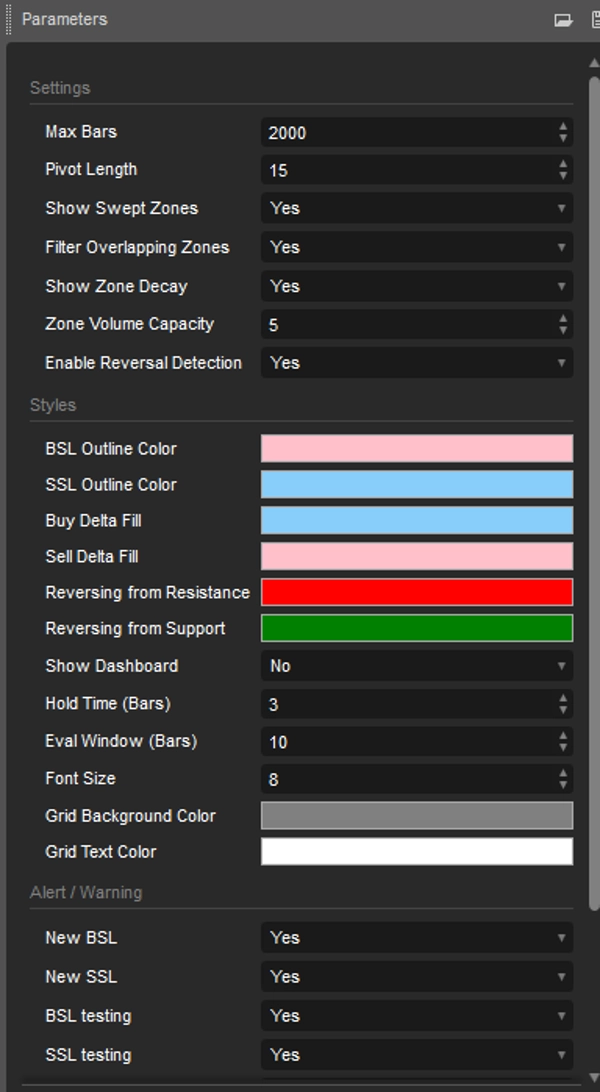
Pengaturan Indikator
Pengaturan
- Panjang Pivot: Periode mundur/maju untuk mendeteksi swing high dan low.
- Max Bars: Indikator mulai menghitung berdasarkan jumlah candlestick historis.
- Tampilkan Zona yang Disapu: Menjaga zona tetap terlihat dengan garis putus-putus setelah zona tersebut ditembus.
- Filter Zona yang Tumpang Tindih: Mencegah pembuatan zona baru yang tumpang tindih dengan zona aktif yang sudah ada.
Peluruhan & Pembalikan
- Tampilkan Peluruhan Zona: Mengaktifkan label persentase kesehatan.
- Kapasitas Volume Zona: Pengali untuk volume rata-rata guna menentukan berapa banyak volume yang dapat diserap zona.
- Aktifkan Deteksi Pembalikan: Mengaktifkan gelembung sinyal untuk pola pembalikan.
Dashboard
- Tampilkan Dashboard: Mengaktifkan tabel pelacakan kinerja.
- Waktu Tahan (Bar): Jumlah bar berturut-turut harga harus tetap dalam keuntungan untuk dianggap sebagai pembalikan yang berhasil.
- Jendela Evaluasi (Bar): Jumlah maksimum bar yang skrip tunggu untuk pembalikan terwujud.
Gaya dan Peringatan
- Gaya: Sesuaikan konfigurasi warna objek. Sembunyikan/Tampilkan Dashboard.
- Peringatan: Nyalakan/matikan peringatan kapan pun BSL&SSL terdeteksi/berpindah/menguji/pembalikan.
Ringkasan
The tool also detects potential reversal signals during liquidity sweeps, displaying four types of volume-based patterns: Absorption (ABS), Exhaustion (EXH), Divergence (DIV), and Snapback Rejection (REJ). These signals help identify unusual volume behavior that may precede price reversals.
A real-time dashboard tracks the historical performance of reversal signals, validating them based on price action within a user-defined evaluation window and hold time. Active zones feature a "Health" metric indicating the extent of volume consumed relative to zone capacity, reflecting liquidity depletion.
Users can customize settings including pivot length, volume capacity, zone visibility, reversal detection toggles, and dashboard display. The indicator supports visualization of liquidity sweeps and reversals, aiding analysis of support and resistance levels through volume and order flow insights.