present
Registrati e ricevi uno sconto da $50 sul tuo primo acquisto
Trading product for RegimeVisualizer Indicatore Flag Volume, image 1
RegimeVisualizer
Indicatore
Versione 1.0, Jul 2026
Windows, Mac
Trading product for RegimeVisualizer Indicatore Flag Volume, image 2
Trading product for RegimeVisualizer Indicatore Flag Volume, image 3
Trading product for RegimeVisualizer Indicatore Flag Volume, image 4
Trading product for RegimeVisualizer Indicatore Flag Volume, image 5
Da 11/01/2025
14.87M
Volume negoziato
1.06M
Profitto in pip

Descrizione

The problem with regime indicators: they change their minds.

Most regime indicators "learn" from the data while they run. You know the result: the history looks beautiful, because the labels of past bars were silently rewritten after the future arrived. This has a name — repainting — and it is the cardinal sin of any analysis tool: it looks reliable precisely because it erases its own mistakes.

Regime Visualizer makes a single promise: it never repaints.

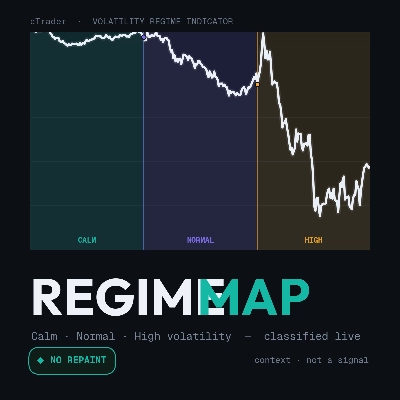
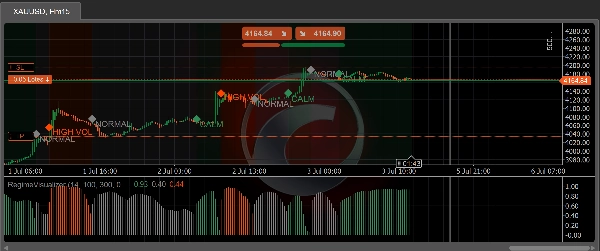
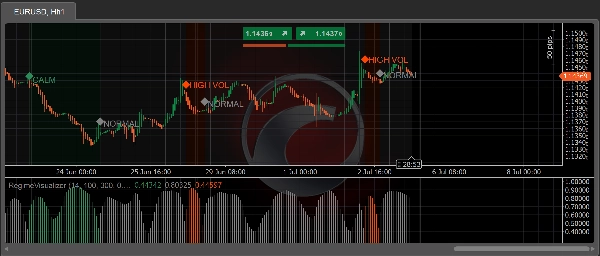
Every bar is classified into one of three volatility regimes — Calm, Normal or High — at the moment it closes. That label is final. It is never recalculated, smoothed or retroactively corrected. The screenshot you take today shows the same thing that was on the screen live, bar by bar. Deterministic: same data, same picture, on every run.

What you see on the chart:

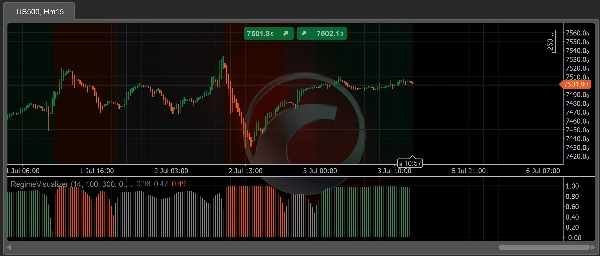
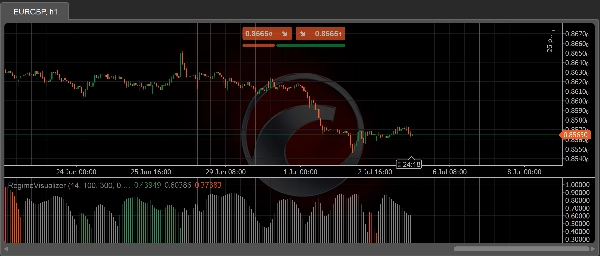
  • 🎨 Colored background per regime segment, right on the price chart
  • 📊 Confidence histogram (0–1) in a separate panel — the filtered probability of the active regime, in the regime's color
  • 🔷 Transition marker — icon + label on the bar where the regime changes
  • Each layer toggles on/off independently, with configurable colors

What it is NOT (read before installing):

  • ❌ Not a trading signal. It never tells you to buy or sell.
  • ❌ No performance promise. Volatility regime does not predict profit — this indicator makes context readable, nothing more. What you do with it is your responsibility.
  • ❌ Not adaptive. There is no online learning — on purpose: "learning while running" is exactly what makes regime indicators repaint.

How it works (for those who want to know):

A 3-state hidden Markov model (HMM) with fixed parameters runs on normalized ATR (ATR(14) / 100-bar ATR average — dimensionless, so it works on any instrument and timeframe). Inference is forward filtering only — it uses nothing but data up to the close of the current bar, with no Viterbi and no backward smoothing (the classic sources of repainting). A hysteresis layer with thresholds and a minimum dwell time turns the flickering argmax into a stable read.

Honest about its limits:

  • The first 300 bars (warmup) stay unlabeled — the indicator does not pretend to know what it does not know yet.
  • The forming bar gets no label — it is classified when it closes. That is the price of never repainting, and we pay it in front of you.

For cBot developers:

The indicator exposes the public RegimeCode series (0 = Calm, 1 = Normal, 2 = High, −1 = warmup) for consumption via Indicators.GetIndicator<RegimeVisualizer>(). Non-repainting volatility context, ready to plug into your logic.

Validation (tested, not claimed):

The non-repaint property was verified by a harness that reprocessed 100,000 real bars across 201 incremental windows — 10.1 million label comparisons, zero divergence — plus bit-identical determinism across runs.

Free. Context — not a signal.

Riepilogo

Profilo indicatore
Categoria indicatore
Volume
Tipo di output
Visualizzazione
Requisiti per i dati
Solo barre
Segnali supportati
Volatilità

Discussioni

Recensioni dei clienti

0.0
Recensioni: 0
Recensioni dei clienti
Questo prodotto non ha ancora ricevuto recensioni. L'hai già provato? Fallo sapere agli altri per primo!

Domande frequenti

Flag
Volume
Market Structure
Supply & Demand
Risk Dashboard
ATR
Liquidity Grab
I prodotti disponibili tramite cTrader Store, inclusi bot di trading, indicatori e plugin, sono forniti da sviluppatori terzi e resi disponibili esclusivamente a scopo informativo e di accesso tecnico. cTrader Store non è un broker e non fornisce consulenze in materia di investimento, raccomandazioni individualizzate o garanzie di risultati futuri.

Potrebbe interessarti anche

Indicatore
Prop
Forex
+12
Introducing High Accuracy multi timeframe Swing high and low detector.
Indicatore
Market Structure
Support & Resistance
Auto-centers price when it moves beyond threshold. Adjustable zoom. Works on any chart type. Never lose price again.
Indicatore
Forex
Crypto
+3
Perfect Trend
Indicatore
ATR
Volume
+2
Nine timeframe cards, vivid candles, native BUY/SELL arrows and adjustable ATR-buffer stop-loss reference lines.
Indicatore
Prop
Forex
+12
Half Trend Cloud
Indicatore
Imbalance
Fair Value Gap
+4
Fair Value Gap scanner with live fill telemetry, 50% CE lines, 4 mitigation rules, and a 3-stage native alert system.
Indicatore
Grid
Prop
+5
Automatically draws major, minor, and trace support/resistance levels at round numbers
Indicatore
XAUUSD
Commodities
A Fair Value Gap (FVG) indicator that identifies potential price imbalances, potential reversal and continuation zones
Indicatore
RSI
AI-assisted
+1
Transform how you view market momentum with the RSI Velocity Gauge Pro. It's FREE FOR ALL
Indicatore
SMC
VWAP
+5
Most advanced Volume Profile Pivot Box indicator — auto pivots, volume zones, smart candle coloring & SMC trading tool.
Indicatore
ATR
Forex
+9
Auto-detect swing highs/lows. Spot reversals, map structure, and filter noise with adjustable strength.
Indicatore
ATR
Key Levels
+1
Explore 88 harmonic price-pattern variants with interactive chart controls and geometric reference levels.
Indicatore
Doji
Wedge
+5
Angora Pattern Recognition is a cTrader indicator that finds, draws and tracks classic chart patterns automatically.
Indicatore
Indices
Commodities
The Advanced CCI & EMA Indicator combines the CCI with 40 & 80 EMA logic to generate precise arrows signaling direction
Indicatore
MACD
Forex
+1
😎Read the description before purchasing💩
Indicatore
Prop
Forex
+11
Ultimate Session Tool: Boxes, OR, KZs, PD Levels, Overlaps, Custom Lines & Names, Info Panel! Highly customizable 📉📈
Indicatore
ATR
MSS
+5
Advanced market structure and institutional cycle mapper with visual reference cards and entry alerts
Indicatore
Indices
Multi-Timeframe ADX Trend Dots & Arrows

Prezzo

Da 11/01/2025
14.87M
Volume negoziato
1.06M
Profitto in pip