
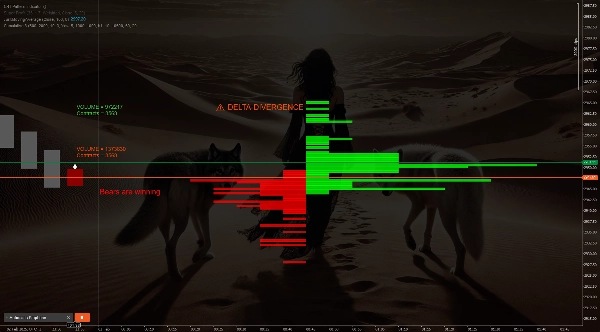
Cumulative Delta Candles + VolumeProfile
Wskaźnik
2.15K pobrania
Wersja 1.0, Feb 2025
Windows, Mac
4.5
Opinie: 2
Opis
Świece delta skumulowane, profil wolumenu, ostrzeżenie o dywergencji delty + sygnały kupna i sprzedaży, miłej zabawy
Podsumowanie
Podsumowanie AI
This indicator combines cumulative delta candles with volume profile analysis to provide insights into market activity. It features delta divergence warnings and generates buy and sell signals based on the interplay of order flow and volume distribution. The tool is designed to assist traders in identifying potential market turning points by highlighting imbalances between buying and selling pressure. It integrates these elements into a single visual interface for use on trading charts.
Profil wskaźnika
Opinie klientów
4.5
Opinie: 2
5 | 50 % | |
4 | 50 % | |
3 | 0 % | |
2 | 0 % | |
1 | 0 % |
Opinie klientów
July 9, 2025
Pros: Combines cumulative delta and volume profile for precise liquidity and order flow analysis. Clear visualization, flexible settings. Stable performance. Cons: No alerts or tooltips. No history of previous profiles. Requires confirmation from additional tools for trading decisions.
April 21, 2025
Dyskusja
Częste pytania
Produkty dostępne za pośrednictwem cTrader Store, w tym boty handlowe, wskaźniki i wtyczki, dostarczane są przez deweloperów zewnętrznych i udostępniane wyłącznie w celach informacyjnych oraz w celu zapewnienia dostępu technicznego. cTrader Store nie jest brokerem i nie zapewnia doradztwa inwestycyjnego, nie udziela spersonalizowanych rekomendacji ani nie gwarantuje przyszłych wyników.

![Logo „Gaussian Channel [Iridio Capital]”](https://cdn.ctrader.com/image/webp/7c039209-5573-4a54-a072-f9528b503103_41960)


Cena
Od 09/01/2025
11.78K
Bezpłatne instalacje