present
Regístrese y obtenga 50 $ de descuento en su primera compra
Trading product for CQL Trend Strength Index Indicador Premium/Discount  Supertrend, image 1
CQL Trend Strength Index
Indicador
52 descargas
Versión 1.1, Aug 2026
Windows, Mac
Trading product for CQL Trend Strength Index Indicador Premium/Discount  Supertrend, image 2
Trading product for CQL Trend Strength Index Indicador Premium/Discount  Supertrend, image 3
Trading product for CQL Trend Strength Index Indicador Premium/Discount  Supertrend, image 4
Trading product for CQL Trend Strength Index Indicador Premium/Discount  Supertrend, image 5
36.24K
Volumen operado
336
Pips ganados
2
Ventas
52
Instalaciones gratis

Descripción

Qué analiza

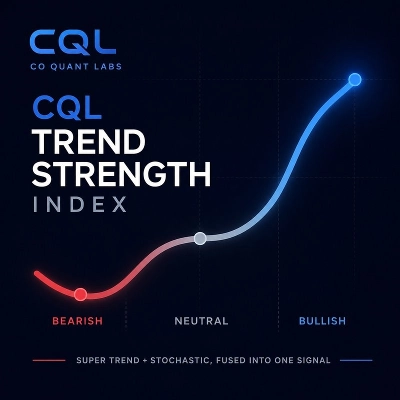
El Índice de Fuerza de Tendencia CQL combina Supertrend y Stochastic en una única señal unificada en lugar de ejecutarlos como dos herramientas separadas en su gráfico. Lee la dirección del precio junto con el impulso y clasifica las condiciones actuales del mercado en uno de tres estados: Compra Fuerte, Venta Fuerte o Rango.

Cómo interpretar la señal

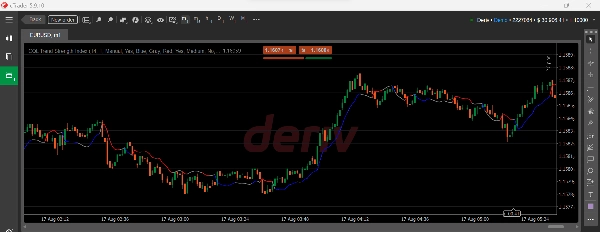
El indicador traza una única línea suavizada directamente sobre el precio. Su color te dice todo de un vistazo:

  • Azul significa Compra Fuerte. El precio y el impulso confirman ambos la fuerza alcista.
  • Rojo significa Venta Fuerte. El precio y el impulso confirman ambos la fuerza bajista.
  • Gris significa Rango. El impulso se encuentra en una zona neutral, señalando baja convicción independientemente de la dirección del precio.

Esta es una herramienta de contexto de tendencia, no un generador de señales de entrada. Te indica el carácter del mercado actual para que puedas aplicar tu propio método de entrada con mejor conocimiento de si estás operando con una tendencia fuerte o en un rango lateral.

Configuraciones y parámetros clave

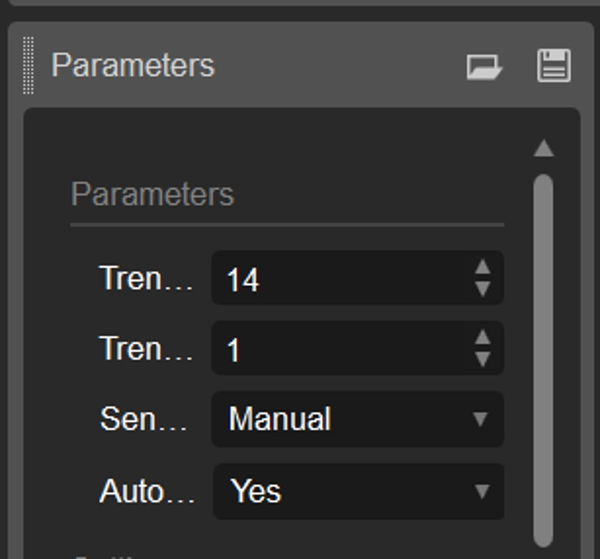
  • Periodo de Tendencia y Reactividad de Tendencia te dan control total sobre la rapidez con que responde el indicador
  • Preajuste de Sensibilidad (Lento, Medio, Rápido, Manual) te permite ajustarlo rápidamente sin tocar números crudos
  • Adaptación Automática al Marco Temporal ajusta la sensibilidad automáticamente según tu gráfico
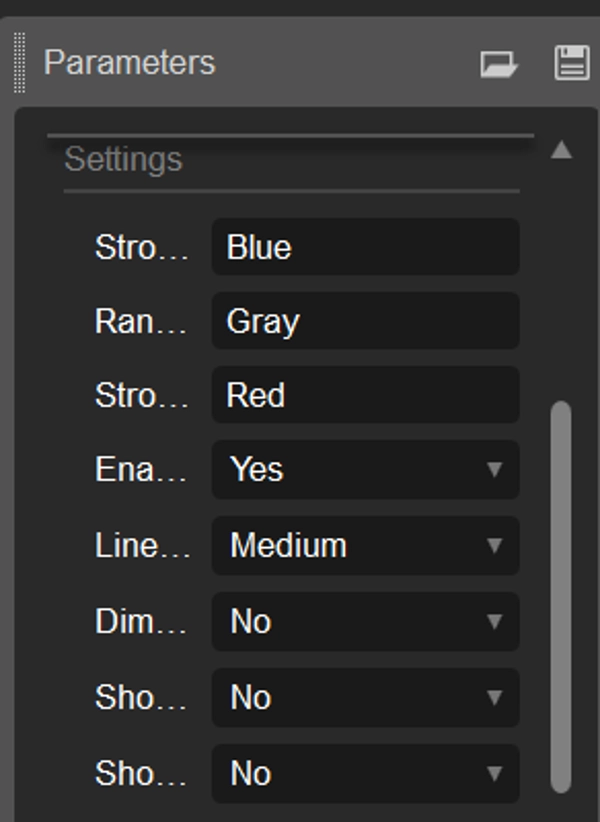
  • La pestaña de Configuraciones cubre personalización completa de colores, grosor de línea, etiquetas de estado, tintado de zona de fondo y una opción para restablecer a valores predeterminados

Casos de uso típicos

  • Confirmar rápidamente si un mercado está en una tendencia fuerte antes de buscar entradas con otra herramienta o método
  • Filtrar condiciones de rango o movimientos erráticos donde las estrategias de seguimiento de tendencia suelen tener un rendimiento inferior
  • Obtener una lectura visual rápida de la salud de la tendencia sin interpretar dos indicadores separados

Para quién es

Operadores que ya tienen un método de entrada, manual o automatizado, y quieren un filtro de contexto de tendencia rápido y confiable superpuesto. Adecuado tanto para operadores discrecionales de swing como para quienes construyen sistemas basados en reglas y necesitan una clasificación clara de tendencia versus sin tendencia.

Limitaciones y notas de uso

  • Este es un indicador de contexto de tendencia, no una señal de entrada de compra o venta. No predice reversals ni genera entradas de operación
  • Como todas las herramientas de seguimiento de tendencia, tendrá retraso al inicio de una nueva tendencia y puede permanecer en Rango durante rupturas de bajo impulso
  • Se recomienda usar junto con tu propia gestión de riesgo y confirmación de entrada, no como un sistema de trading independiente

Resumen

Resumen de IA
The CQL Trend Strength Index is a technical indicator that combines Supertrend and Stochastic signals into a single, smoothed line plotted directly on the price chart. It classifies market conditions into three states: Strong Buy (blue), Strong Sell (red), or Ranging (gray), reflecting the combined analysis of price direction and momentum. This indicator serves as a trend context tool, helping traders quickly assess whether the market is trending strongly or moving sideways, rather than generating specific trade entry signals.

Key features include adjustable Trend Period and Reactivity settings, sensitivity presets (Slow, Medium, Fast, Manual), and automatic adaptation to the chart’s timeframe. Users can customize colors, line thickness, labels, and background zone tinting. Typical use cases involve confirming strong trends before applying entry methods, filtering out ranging conditions where trend-following strategies may underperform, and obtaining a clear visual read of trend health without managing multiple indicators.

Designed for traders with existing entry strategies, it supports discretionary and rule-based trading by providing a reliable trend versus no-trend classification. The indicator requires integration with personal risk management and entry confirmation techniques and is intended for use across various markets where price bars are available.
Perfil del indicador
Categoría del indicador
Tendencia
Tipo de resultado
Visualización
Requisitos de datos
Únicamente barras
Señales admitidas
Fuerza de la tendencia

Valoraciones de clientes

0.0
Valoraciones: 0
Valoraciones de clientes
Este producto todavía no se ha valorado. ¿Ya lo ha probado? Sea el primero en informar a otros.

Conversación

Preguntas frecuentes

Premium/Discount
Supertrend
MSS
Stochastic
Los productos disponibles a través de cTrader Store, incluidos bots, indicadores y plugins para operar, son proporcionados por desarrolladores de terceros y están disponibles únicamente con fines informativos y de acceso técnico. cTrader Store no es un bróker, por lo que no proporciona asesoramiento de inversión, recomendaciones personales ni ninguna garantía de rentabilidad futura.

Más de este autor

Logotipo de "Vix75 Shield"
Estadísticas en vivo
$85
/
$150
cBot
Forex
Crypto
+4
Stay on the right side of every major move on the Volatility 75 Index, automatically. No charts, no decisions.
7.6%
ROI
2.6
Factor de beneficio

Puede interesarle

Indicador
EMA
RSI
+2
Advanced TDI indicator with Shark Fin signals, chart arrows, MTF RSI, divergence detection and smart alerts.
Indicador
Forex
BTCUSD
+10
6-stage IIR filter trend indicator with colored line segments, reversal signals, alerts, and entry arrows.
Indicador
ATR
BTCUSD
+5
Trailing algo 📈 auto-tracks trends 🎯 adapts to volatility 🌟 precise moves 🛡️ retest signals 🚀 no lag, smart market
Indicador
Forex
EURUSD
+3
ATR-normalized MA slope in degrees, comparable across all instruments. Color-coded labels flag strong trend moves.
Indicador
ATR
Volume
+5
Order blocks with measured hold-rate stats and confidence scoring — not just zones on a chart.
Indicador
EMA
RSI
+5
MACD Colour Histogram with 11 Moving Average Types, Multi-timeframe confirmation and Sound Signal Alert.
Indicador
Pin Bar
Inside Bar
+2
Advanced candlestick pattern recognition with structural quality scoring, alerts and adaptive chart visuals.
Indicador
Allow trader to draw multi trendlines in different timeframes on one chart,Give trader an overview of the current market
Indicador
SMC
Forex
+4
Identifies institutional zones with Volume Delta (K) across any asset or chart for high-precision entry detection.
Indicador
RSI
Forex
+4
New version of one of my favorites includes Fibonacci and moving average convergence divergence lines
Indicador
ATR
RSI
+5
Supply and demand zones with break of structure, higher timeframe MA signals, a percent stop and three targets.
Indicador
MACD
Prop
+8
NTNPICLL is a tool to check the best trading hours for the assets and also includes the highest and lowest point
Indicador
AI
ATR
+27
CRTIndicator
Indicador
Scalpers Volume Profile
Indicador
ADX
MACD
+3
Displays Boshi Chanlun Structure Indicator chart structures for supported Pepperstone cTrader symbols and timeframes.
Indicador
ADX
ATR
+5
SuperTrend signals scored on five confluence factors, with an ATR stop, three targets and a dashboard.
Indicador
ATR
RSI
+6
PrimeTrend: ATR trendline detects reversals, plots entry/SL/3 targets. Tune params (speed vs. robustness). Backtest +
Indicador
Forex
BTCUSD
+9
🎯 Automatically identify significant breakouts from price consolidation zones.

Precio

36.24K
Volumen operado
336
Pips ganados
2
Ventas
52
Instalaciones gratis