Opis
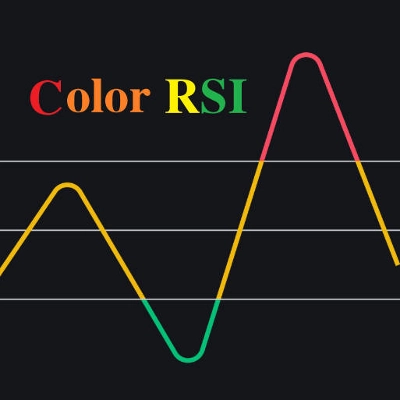
To jest super wskaźnik, który integruje wskaźnik RSI z systemem podwójnej średniej kroczącej. Intensywność RSI jest reprezentowana przez cztery kolory: czerwony (>70) > pomarańczowy (>50) > żółty (>30) > zielony. Podwójne średnie kroczące używają EMA z domyślnymi parametrami ustawionymi na 48/144, które można dostosować do swoich potrzeb.
Jak używać:
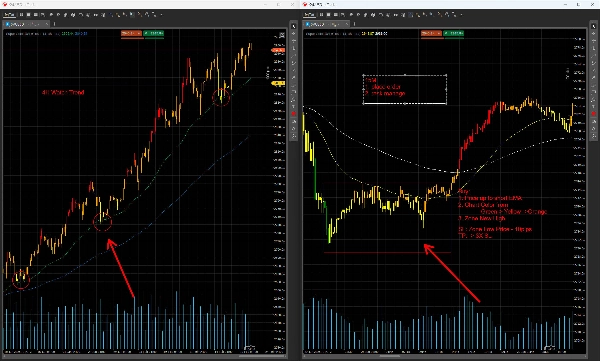
Gdy jest używany w połączeniu z wieloma ramami czasowymi (np. 4H→15M; 1H→5M, tutaj zilustrowano na przykładzie 4H→15M):
- Identyfikacja trendu za pomocą podwójnych EMA (ramka czasowa 4H):
-
- Trend wzrostowy: 48EMA powyżej 144EMA.
- Trend spadkowy: 48EMA poniżej 144EMA.
- Konsolidacja w zakresie: Dwie EMA są splątane.
- Punkty wejścia/wyjścia na ramce czasowej 15M:
-
- Ustawienie kupna (trend wzrostowy):
-
- Cena cofa się do 48EMA na wykresie 4H.
- Przełącz na 15M: Wejdź, gdy cena przebije powyżej zakres konsolidacji 15M.
- Stop loss: Ustaw na ostatnim szczycie +10 pipsów .
- Ustawienie sprzedaży (trend spadkowy):
-
- Cena cofa się do 48EMA na wykresie 4H.
- Przełącz na 15M: Wejdź, gdy cena przebije poniżej zakres konsolidacji 15M.
- Stop loss: Ustaw na ostatnim dołku –10 pipsów .
- Sygnały dywergencji cenowej:
-
- Dywergencja niedźwiedzia (szczyt):
-
- Cena tworzy nowy szczyt (na cofnięciu), ale kolor RSI zmienia się z czerwonego (RSI >70) na pomarańczowy (RSI >50) .
- Dywergencja byka (dołek):
-
- Cena tworzy nowy dołek (na cofnięciu), ale kolor RSI zmienia się z zielonego (RSI ≤30) na żółty (RSI ≤50) .
Ostrzeżenie o ryzyku:
Żaden wskaźnik nie pasuje do wszystkich warunków rynkowych. Przetestuj tę strategię dokładnie w środowisku demo przed zastosowaniem jej w handlu na żywo. Nieprawidłowe użycie może prowadzić do znacznych strat.
Podsumowanie
Profil wskaźnika
Opinie klientów
0.0
Opinie: 0
Opinie klientów
Ten produkt nie ma jeszcze opinii. Wypróbowałeś(-aś) go już? Bądź pierwszy(-a) i powiedz o tym innym!
Dyskusja
Częste pytania
Prop
Forex
Indices
Commodities
RSI
Crypto
Stocks
Produkty dostępne za pośrednictwem cTrader Store, w tym boty handlowe, wskaźniki i wtyczki, dostarczane są przez deweloperów zewnętrznych i udostępniane wyłącznie w celach informacyjnych oraz w celu zapewnienia dostępu technicznego. cTrader Store nie jest brokerem i nie zapewnia doradztwa inwestycyjnego, nie udziela spersonalizowanych rekomendacji ani nie gwarantuje przyszłych wyników.


Cena
Od 30/09/2024
44
Sprzedaż