Descrizione
Indicatore VPD
VPD è un indicatore consigliato per chi effettua operazioni intraday, in qualsiasi simbolo Forex.
Consiste in un'associazione di alcuni parametri, che sono:
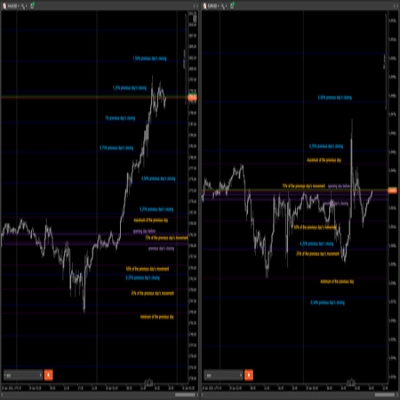
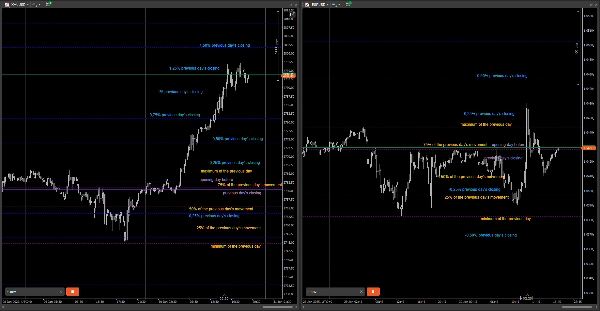
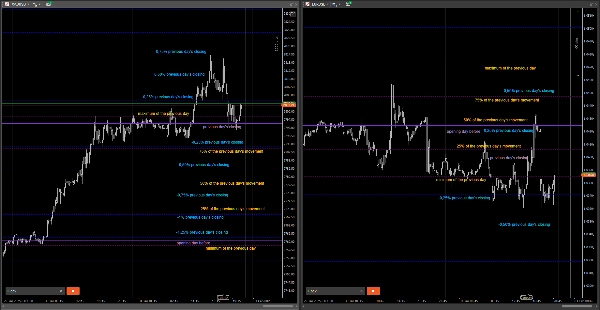
• Apertura e chiusura del giorno precedente;
• Massimo e minimo del giorno precedente con le variazioni delle percentuali intermedie del 25%, 50% e 75% (sono configurabili) dell'intero movimento del giorno precedente;
• Variazioni di prezzo in percentuale rispetto alla chiusura del giorno precedente di -2%, -1,75%, -1,50% ... +1,50%, +1,75%, +2% (sono configurabili).
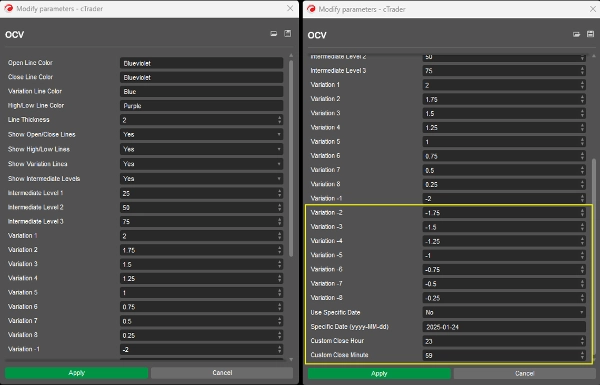
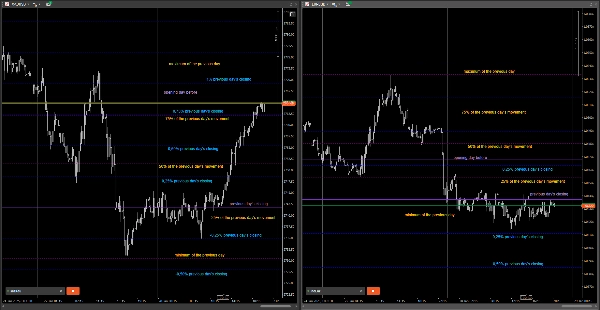
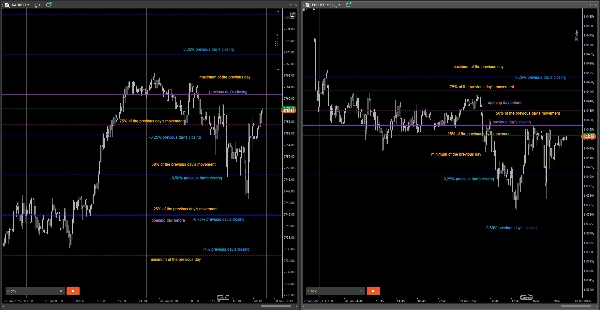
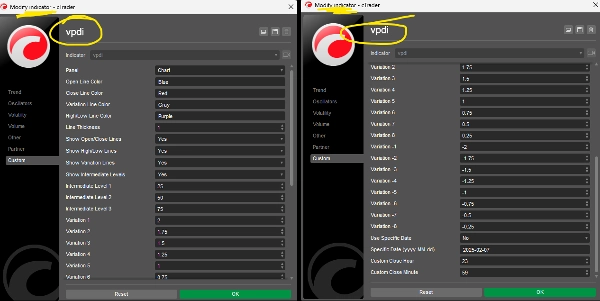
Puoi scegliere di cambiare i colori, lo spessore delle linee e le percentuali, oltre a decidere quali vuoi mostrare sul grafico, come negli esempi seguenti.
Se vuoi che venga mostrato in un periodo di tempo specifico, puoi indicare la data e l'ora.
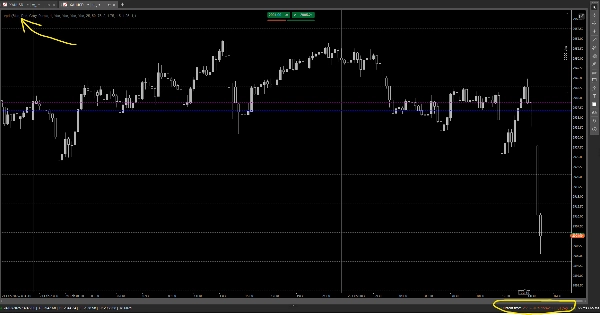
(Nella stampa è come cbot, ma successivamente l'ho cambiato in indicatore.)
Ho aggiornato con uno screenshot (che mostra l'indicatore sul grafico) con la data di oggi (25/02/2025).
E-mail di contatto: ortsac.nanido@gmail.com


