VIX - volatility indicator - Renko
Wskaźnik
Wersja 1.0, Feb 2025
Windows, Mac
Opis
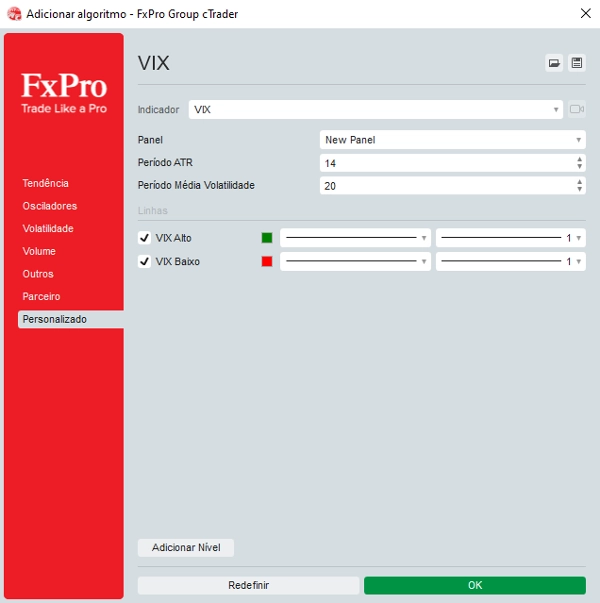
Dostosuj parametry: Wprowadź żądane wartości dla poziomów LowLevel i HighLevel oraz dostosuj współczynnik skali VIX, aby linia VIX miała pożądaną wysokość.
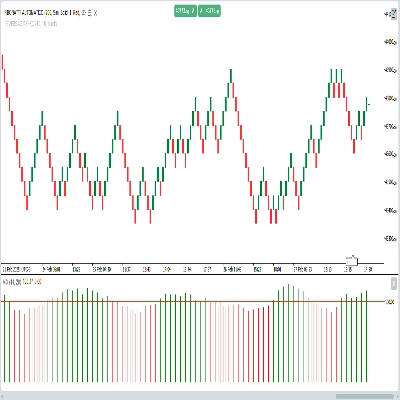
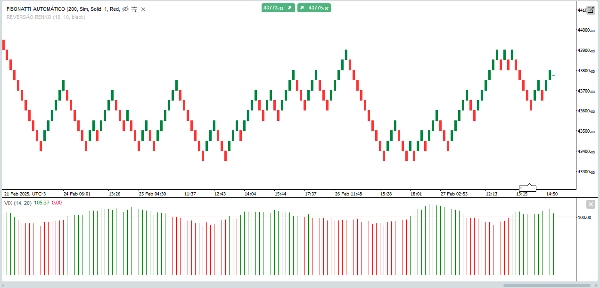
Spójrz na wykres:
Gdy VIX przekracza poziom HighLevel, a wolumen jest wysoki (zielone świece), można uznać, że nastąpiło wybicie.
Gdy VIX jest poniżej poziomu LowLevel, może to wskazywać na okres niskiej zmienności.
Podsumowanie
Profil wskaźnika
Opinie klientów
0.0
Opinie: 0
Opinie klientów
Ten produkt nie ma jeszcze opinii. Wypróbowałeś(-aś) go już? Bądź pierwszy(-a) i powiedz o tym innym!
Dyskusja
Częste pytania
Breakout
Produkty dostępne za pośrednictwem cTrader Store, w tym boty handlowe, wskaźniki i wtyczki, dostarczane są przez deweloperów zewnętrznych i udostępniane wyłącznie w celach informacyjnych oraz w celu zapewnienia dostępu technicznego. cTrader Store nie jest brokerem i nie zapewnia doradztwa inwestycyjnego, nie udziela spersonalizowanych rekomendacji ani nie gwarantuje przyszłych wyników.


Cena
Od 05/02/2025
30
Sprzedaż