
Opis
✔ Strona internetowa do wprowadzania danych, zakładka wskaźników: https://tradingeconomics.com/
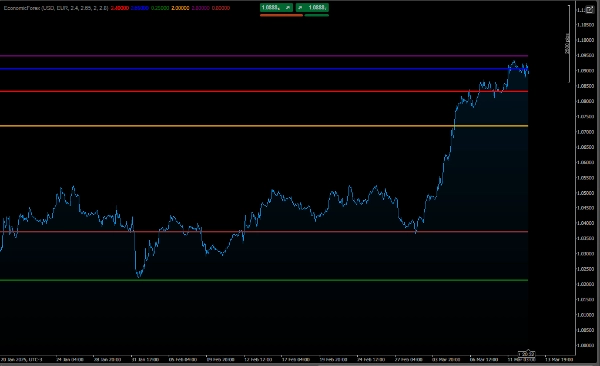
Jak interpretować wykres
Różnica między nominalnymi a realnymi stopami procentowymi:
Nominalna stopa procentowa to wartość brutto stopy procentowej.
Realna stopa procentowa uwzględnia inflację, pokazując rzeczywistą siłę nabywczą pieniędzy.
Jeśli inflacja jest wyższa niż nominalna stopa procentowa, realna stopa procentowa będzie ujemna, co wskazuje na utratę siły nabywczej.
Porównanie walut:
Wykres pozwala porównać warunki gospodarcze obu walut.
Na przykład, jeśli realna stopa procentowa głównej waluty jest wyższa niż waluty kontrahenta, może to wskazywać, że główna waluta jest bardziej atrakcyjna do inwestycji.
Ewolucja w czasie:
Linie pokazują, jak zmieniają się inflacja, nominalne i realne stopy procentowe w czasie, pozwalając zidentyfikować trendy.
Przykład użycia
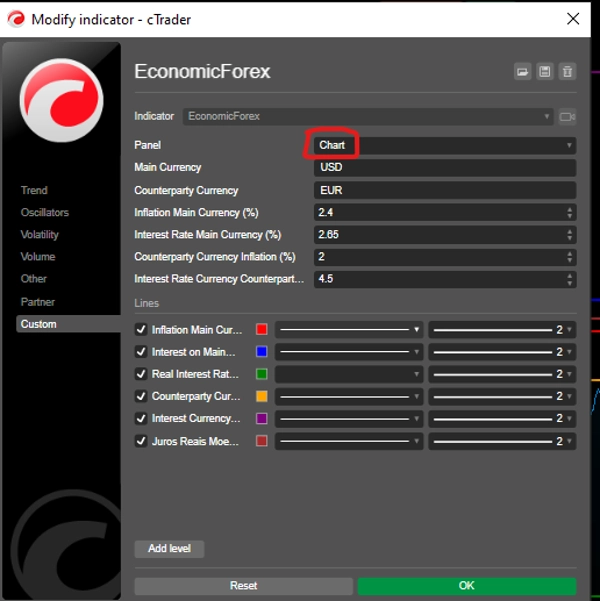
Załóżmy, że ustawisz parametry w następujący sposób:
Główna waluta: USD (dolar amerykański)
Inflacja: 5%
Nominalna stopa procentowa: 6,5%
Waluta kontrahenta: EUR (euro)
Inflacja: 2%
Nominalna stopa procentowa: 4%
Wykres pokaże:
USD:
Realna stopa procentowa: 1,5% (6,5% - 5%)
EUR:
Realna stopa procentowa: 2% (4% - 2%)
Dzięki temu możesz porównać warunki gospodarcze USD i EUR oraz podejmować świadome decyzje na rynku forex.
Podsumowanie
Ten kod jest przydatnym narzędziem dla traderów i analityków, którzy chcą monitorować i porównywać wskaźniki ekonomiczne dwóch walut w parze forex. Dostarcza informacji o inflacji, nominalnych stopach procentowych i realnych stopach procentowych, pomagając zrozumieć scenariusz makroekonomiczny i jego implikacje dla rynku forex.
zobacz ten algorytm niskiego ryzyka:👇🏻
https://ctrader.com/pt/products/601?u=carneiroads
https://ctrader.com/pt/products/623?u=carneiroads
Podsumowanie
The indicator distinguishes between nominal interest rates (the gross interest rate) and real interest rates (adjusted for inflation), highlighting the purchasing power of money. It allows comparison of economic conditions between a main currency and a counterparty currency by plotting their respective inflation, nominal, and real interest rates over time. This helps identify trends and relative investment attractiveness; for example, a higher real interest rate in the main currency compared to the counterpart may indicate greater investment appeal.
Users input data such as inflation and nominal interest rates for each currency, which can be sourced from economic data websites like TradingEconomics.com. The tool supports informed decision-making in the forex market by providing a clear view of evolving economic factors affecting currency pairs.


