
Heikin Ashi Candlestick
Indicator
2 downloads
Version 1.0, Sep 2025
Windows, Mac
Description
Heikin Ashi Candlestick Indicator
This indicator displays Heikin Ashi candles directly on your chart.
Installation:
- Drag indicator onto desired chart.
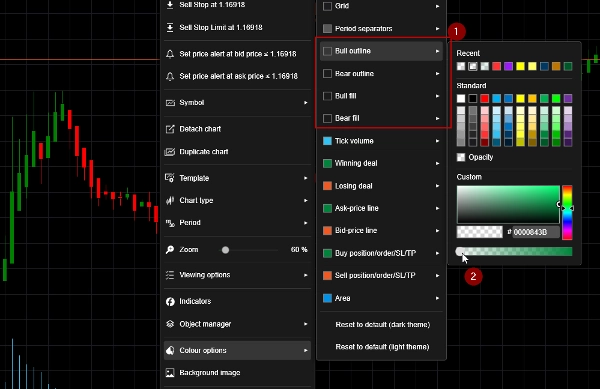
- Right click on chart select "Colour options".
- Set Bull Outline, Bull Fill, Bear Outline and Bear Fill to "Transparent". See the screenshot 1.
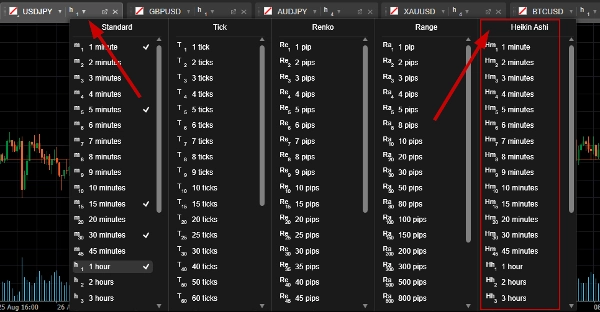
To show Heikin Ashi candles without indicators, see screenshot 2.
Summary
AI summary
The Heikin Ashi Candlestick indicator displays Heikin Ashi candles directly on trading charts. It modifies traditional candlestick visuals to provide a smoothed representation of price action, which can help in identifying trends more clearly. Installation involves dragging the indicator onto the desired chart and adjusting color settings to make the standard candle outlines and fills transparent, allowing the Heikin Ashi candles to be prominently displayed. This indicator is applicable across multiple markets including Forex, cryptocurrencies, and stocks. It integrates seamlessly with existing chart setups to enhance visual analysis without altering underlying price data.
Indicator profile
Customer reviews
0.0
Reviews: 0
Customer reviews
No reviews for this product yet. Already tried it? Be the first to tell others!
Discussion
FAQ
Forex
Crypto
Stocks
Products available through cTrader Store, including trading bots, indicators and plugins, are provided by third-party developers and made available for informational and technical access purposes only. cTrader Store is not a broker and does not provide investment advice, personal recommendations or any guarantee of future performance.


Price
Since 15/06/2025
673
Free installs