Description
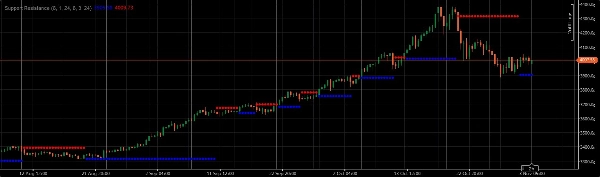
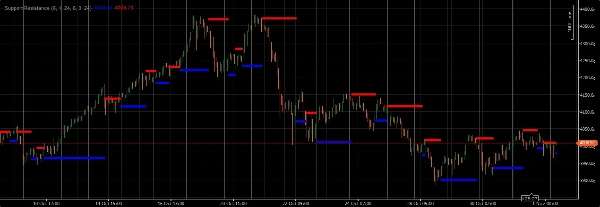
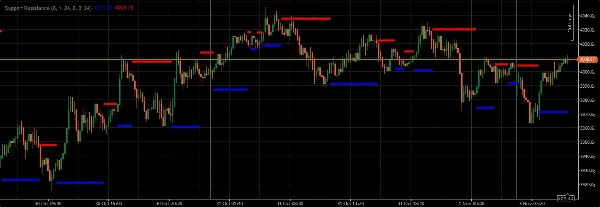
When trading gold, use support and resistance levels across various timeframes (large, range, and tick charts) to identify potential pivot breakouts or support/resistance points. Always confirm these signals with other technical indicators like moving averages, oscillators, and candlestick patterns for higher probability trades
When trading gold, use support and resistance levels across various timeframes (large, range, and tick charts) to identify potential pivot breakouts or support/resistance points. When trading gold, use support and resistance levels across various timeframes (large, range, and tick charts) to identify potential pivot breakouts or support/resistance points. These levels, once identified, can serve as crucial decision points. A breakout above resistance or below support, especially when accompanied by increased body candle, often signals a continuation of the trend or a significant shift in market sentiment. Conversely, a bounce off a support level or a rejection at resistance can indicate a potential reversal or a continuation of the current consolidation. Always confirm these signals with other technical indicators like moving averages, oscillators, and candlestick patterns for higher probability trades. Furthermore, pay close attention to news events and economic data releases, as these can dramatically impact gold prices and invalidate purely technical setups. Risk management is paramount; never risk more than a small percentage of your trading capital on any single trade.
Summary
Customer reviews
5 | 100 % | |
4 | 0 % | |
3 | 0 % | |
2 | 0 % | |
1 | 0 % |


