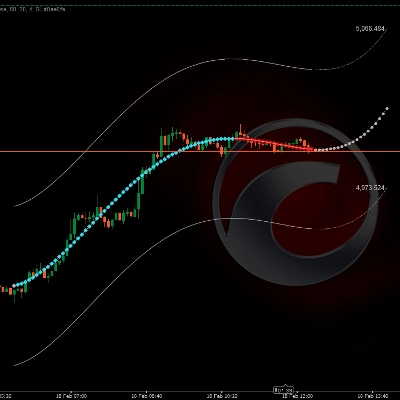
Brokers & props
For business
00
Days
:
00
Hours
:
00
Minutes
:
00
Seconds
Polynomial Price Projection Channel
Indicator
Version 1.0, Feb 2026
Windows, Mac
Sinceย 03/10/2024
Sales
135
Free installs
27721
"Polynomial Price Projection Channel" uploaded image"Polynomial Price Projection Channel" uploaded image"Polynomial Price Projection Channel" uploaded image


๐Ÿ“Š Polynomial Price Projection Channel


https://chartshots.spotware.com/c/699603101593d

๐Ÿ”Ž WHAT DOES IT DO? 

https://chartshots.spotware.com/c/69960348da652


Fits a mathematical curve over the last N price closes and extends it into the future as a projection. Around that curve it draws an upper and lower channel whose width automatically adapts to recent market volatility.

โš™๏ธ HOW DOES THE LOGIC WORK?

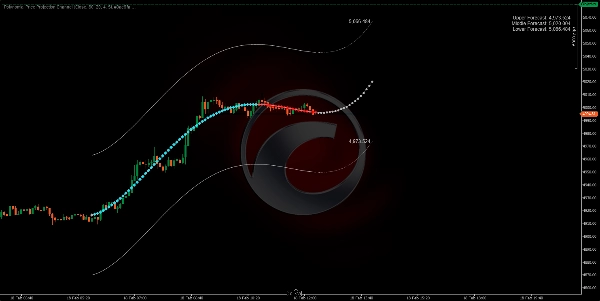
  1. Takes the last N candles (Lookback Bars) and calculates the polynomial curve that best fits those prices using least squares.
  2. Extends the curve forward (Forecast Bars) as a mathematical projection of the current trend.
  3. Builds the channel by shifting the curve up and down using the maximum candle range of the analyzed period ร— 2.


https://chartshots.spotware.com/c/6996039a07e3a

๐Ÿ› ๏ธ KEY PARAMETERS

Parameter

Default

Purpose

Lookback Bars

80

How many historical candles it analyzes

Forecast Bars

20

How many candles it projects forward

Polynomial Order

4

Curve flexibility (higher = more curves)

Data Input

Close

Base price for the calculation


๐ŸŽฏ HOW TO USE IT?

๐ŸŸข Potential Buy โ†’ Price touches the lower band and the projection points upward.
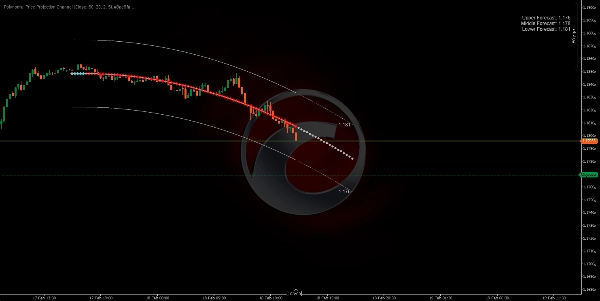
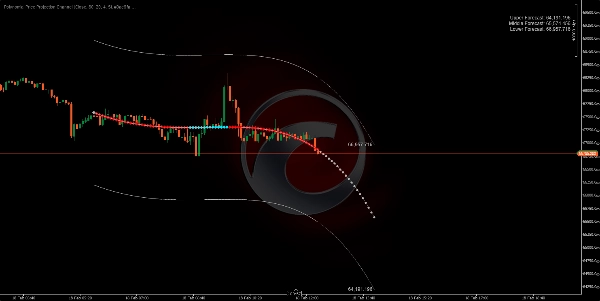
๐Ÿ”ด Potential Sell โ†’ Price touches the upper band and the projection points downward.

โš ๏ธ Always confirm with other factors before trading. This indicator is a mathematical extrapolation, not a guaranteed prediction.

0.0
Reviews: 0
Customer reviews
No reviews for this product yet. Already tried it? Be the first to tell others!
NAS100
NZDUSD
XAUUSD
Commodities
Forex
Signal
EURUSD
Bollinger
GBPUSD
BTCUSD
AI
Indices
Prop
ATR
Stocks
Crypto
USDJPY

More from this author

Indicator
RSI
XAUUSD
Breakout
+6
ZigZag
ZigZag filters noise, spots trends, patterns, pivots, aiding analysis, trade management, and confirmations. ๐Ÿ“‰๐Ÿ“ˆ
Indicator
RSI
XAUUSD
Breakout
+6
Order Block
Identify bullish and bearish Order Blocks to spot key support/resistance levels and potential trend reversals! ๐Ÿ“ˆ๐Ÿ”„
Indicator
RSI
Breakout
XAUUSD
+5
Auto-Trend Channel
Adaptive trend channel using linear regression and Pearson correlation for dynamic support, resistance, and trends.
Indicator
RSI
XAUUSD
Breakout
+5
BOS & CHOCH
Market structural patterns , specifically the concepts of Change of Character (ChoCH) ๐Ÿ”„ and Break of Structure (BoS) ๐Ÿ’ฅ
Indicator
RSI
Breakout
XAUUSD
+6
Volume POC Heatmap
๐Ÿ“Š Shows volume by price levels, highlights POC, and key zones. Identifies dynamic support/resistance and imbalances.
Indicator
RSI
Breakout
Supertrend
All Support and Resistance Levels
"Identify key market zones and visualize support/resistance from multiple timeframes on a single chart.
Indicator
RSI
Breakout
XAUUSD
+5
Zones Supply Demand
๐Ÿ“ŠZones Supply & Demand: Identifies key price levels with high volume concentration, marking Supply/Demand Zones & Marke
Indicator
RSI
Breakout
XAUUSD
+5
Supertrend
๐Ÿ’น Define a price channel ๐Ÿ“ˆ and determine trend direction (bullish ๐ŸŸข or bearish ๐Ÿ”ด).
Indicator
RSI
Breakout
XAUUSD
+6
Fair Value Gap Sessions
identify and highlight temporary market inefficiencies known as "fair value gaps" ๐Ÿšจ within specific trading Sessions.
Indicator
RSI
Breakout
XAUUSD
+4
Dynamic Market Structure Analysis of Turning Points
Identify market structure effortlessly with swing highs, lows, CHoCH, and BOS levels for smart trading decisions! ๐Ÿ“Š๐Ÿ”"
Indicator
Indices
RSI
XAUUSD
+7
RSI Divergence
Detects bullish and bearish divergences
Indicator
RSI
Breakout
Supertrend
Trend Heikin Multi MA
๐Ÿš€ TrendHeikinMultiMA: Advanced trend detection using Heikin-Ashi smoothing & MAs! Eliminates noise, confirms real trend

You may also like

Indicator
NAS100
NZDUSD
Martingale
+26
OHLC PRO by LudwigICT
OHLC PRO โ€“ Advanced Session & Market Structure Tool
Indicator
NAS100
RSI
NZDUSD
+18
Market Cipher A
Market Cipher A
Indicator
NAS100
NZDUSD
XAUUSD
+16
Swing AVWAP Pro
Adaptive Swing-Anchored VWAP that tracks market structure shifts with precision and clarity.
Indicator
Grid
XAUUSD
Forex
+3
Daily Open Color Zones
indicator showing the Daily Open Line and instantly shading bullish and bearish zones.
Indicator
Breakout
Fx4U.Multi TimeFrame Support & Resistance
Allow trader to visualize Support & Resistance across different timeframes,give trader an overview of the current market
Indicator
Signal
FAMA-MAMA
The FAMA-MAMA Indicator is a powerful, adaptive trend-following tool designed for professional and algorithmic traders.
PVA Volume+Analysis_noSourceCode
PVA Volume Analysis Indicator:Price volume over trend strength and direction
Indicator
NAS100
NZDUSD
Breakout
+14
Adaptive Trailing System
๐Ÿš€ Adaptive trailing stop that uses logarithmic normalized volatility....
Renko Wicks
Renko Wicks
Indicator
Breakout
Waddah Attar Explosion
Combines MACD momentum with Bollinger Bands volatility to identify explosive price breakout moments.
Fibonacci Pitchfan
Powerful all-in-one toolย for traders seeking aย clear, dynamic viewย of market structure. By mergingย pivots, trendlines &
Indicator
NAS100
RSI
NZDUSD
+10
CVD Ai
"Advanced VSA & CVD indicator with 'A+ Setup' filtering based on Support & Resistance levels."