Indicator
Breakout
Bollinger
Pressure Scanner
"Pressure Scanner" logo
03/11/2025
Desktop
"Pressure Scanner" uploaded image

Pressure Scanner πŸ”πŸ“Š


1. What Pressure Scanner does

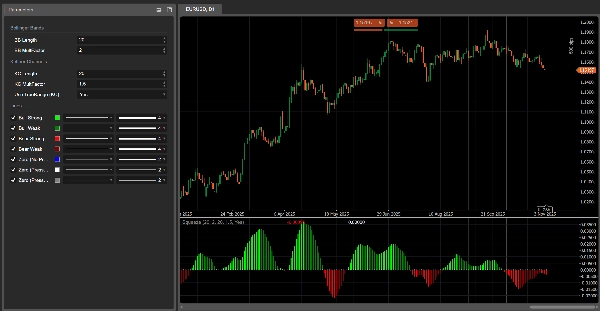
Pressure Scanner is a volatility-and-direction tool that:

  • detects when the market is under volatility pressure / compression βœ…
  • shows when that pressure is released into expansion πŸ’₯
  • measures the direction and strength of the resulting price drive through a scanner value plotted as a histogram.

It combines:

  • a Bollinger-style price band,
  • a Keltner-style volatility channel,
  • and a linear-regression-based scanner line,

to display both pressure states (on / released / neutral) and the directional impulse (up or down).


2. How it works (logic)

  1. Source
    The indicator uses the closing price as the main input.
  2. Outer volatility band (BB-style)
    • Basis = SMA(close, BB Length)
    • Deviation = KC MultFactor Γ— standard deviation of close
    • Upper band = basis + deviation
    • Lower band = basis βˆ’ deviation
  3. Inner volatility channel (KC-style)
    • Center = SMA(close, KC Length)
    • Range = either True Range or Highβˆ’Low (set by Use TrueRange)
    • Range average = SMA(range, KC Length)
    • Upper channel = center + rangeAvg Γ— KC MultFactor
    • Lower channel = center βˆ’ rangeAvg Γ— KC MultFactor
  4. Pressure states
    By comparing the outer band and the inner channel:
    • Pressure ON – black dots at zero
      • Lower band > lower channel and upper band < upper channel
      • The band is fully inside the channel β†’ volatility is compressed, high pressure.
    • Pressure RELEASED – gray dots at zero
      • Lower band < lower channel and upper band > upper channel
      • The band is fully outside the channel β†’ volatility is expanding after pressure.
    • Neutral pressure – blue dots at zero
      • Any other configuration.
  5. Scanner value (val)
    The histogram shows a scanner value computed via linear regression:
    • Over the last KC Length bars, the indicator finds:
      • highest high,
      • lowest low,
      • SMA of close.
    • It builds a dynamic midline:
      • rangeMid = (highest + lowest) / 2
      • combinedMid = average(rangeMid, SMA(close))
    • Then it defines:
      scannerInput=closeβˆ’combinedMid\text{scannerInput} = \text{close} - \text{combinedMid}scannerInput=closeβˆ’combinedMid
    • A linear regression over KC Length bars is run on this scannerInput, and the final value at the last bar is the scanner value val.

Interpretation:

  • val > 0 β†’ price is pressing above the midline β†’ bullish pressure
  • val < 0 β†’ price is pressing below the midline β†’ bearish pressure
  • changes in val bar-to-bar β†’ increase or decrease in that directional pressure.


3. How to read the colors

Histogram – directional pressure (scanner value)

Each bar of the histogram corresponds to val and is colored as:

  • Lime – val > 0 and rising (val > previous val)
    β†’ strong bullish pressure, scanner value strengthening upward.
  • Green – val > 0 but falling (val ≀ previous val)
    β†’ still bullish, but pressure is fading.
  • Red – val < 0 and dropping further (val < previous val)
    β†’ strong bearish pressure, downward drive intensifying.
  • Maroon – val < 0 but rising (val β‰₯ previous val)
    β†’ still bearish, but pressure is losing strength.

So:

  • Above 0 β†’ bullish pressure regime
  • Below 0 β†’ bearish pressure regime
  • Color change on the same side of 0 = pressure accelerating vs slowing.

Zero line – pressure states

Dots plotted at zero show the pressure state:

  • Blue – neutral pressure (normal volatility)
  • Black – Pressure ON (compression active)
  • Gray – Pressure RELEASED (expansion after compression)


4. Parameter reference (English)

BB Length
Period for the SMA and standard deviation used in the outer volatility band.

  • Shorter β†’ more reactive band, more frequent pressure changes.
  • Longer β†’ smoother band, fewer but more β€œmacro” signals.

BB MultFactor
Multiplier for the deviation of the outer band (kept as a user parameter for flexibility).
In this port, the deviation behaviour is tied to KC MultFactor as in the original formula, but you can adapt it if you want a different band style.

KC Length
Period for:

  • the center line of the volatility channel,
  • the range smoothing,
  • the high/low window and the scanner regression.

Defines how far back Pressure Scanner looks to estimate volatility structure and directional pressure.

KC MultFactor
Controls the width of the volatility channel and the outer band.

  • Larger value β†’ wider channel, fewer Pressure ON states.
  • Smaller value β†’ tighter channel, more frequent pressure signals.

Use TrueRange (KC)

  • true β†’ channel range uses True Range (captures gaps and sharp moves).
  • false β†’ range is simply High βˆ’ Low.


0.0
Reviews: 0
Customer reviews
No reviews for this product yet. Already tried it? Be the first to tell others!
More from this author
cBot
NAS100
NZDUSD
Martingale
+26
ElliottWaveBot
N.B.: Results with an initial invested capital of 100 euros.
cBot
Indices
RSI
Forex
+2
US 2000+MACD+ADR+ADMIR+RSI+MANY MORE-TF4M
N.B.: Results with an initial invested capital of 100 euros.
Indicator
NAS100
NZDUSD
Martingale
+26
Volume Delta
Read aggressive flow in real time. Flexible resets (Day/Week/Month), optional EMA smoothing, and non-repainting cumulati
cBot
Breakout
ATR
Signal
EMA Up&Down 2025 Ctrader bot
✨ N.B.: Results with an initial invested capital of 100 euros.πŸ“ˆ
Indicator
Grid
NZDUSD
XAUUSD
+16
vWAP Free
Editions: Free (core VWAP + bands) Β· Pro (multi‑VWAP, click‑to‑anchor, alerts).
cBot
Indices
ATR
US500 LONG&SHORT TF 5M ALL SEASON!
πŸš€N.B.: Results with an initial invested capital of 100 euros.
EMA UP&DOWN 2025
SectorIndex Dual Moving Average Indicator: Your Market Compass 🧭
cBot
NAS100
NZDUSD
Martingale
+26
Dynamic Trendline Deluxe Pro Cbot - PROP edition
Major Update Announcement: Advanced Prop Firm Risk Management is Here! πŸš€
Indicator
NAS100
NZDUSD
Martingale
+26
Breakout channel
Breakout Channels automatically detects consolidation ranges and highlights when price breaks out of them.
Indicator
NAS100
Breakout
XAUUSD
+14
Initial Range
Initial Range – Where the open writes the script.
Indicator
NAS100
NZDUSD
Breakout
+14
ZIG ZAG Free
ZigZag Free is a clean swing-detection tool that marks significant pivot highs/lows
Indicator
Grid
NAS100
NZDUSD
+19
Supertrend-algo
Algorithmic trend precision for cTrader.
cBot
RSI
BASIC us500 SHORT 35%
N.B.: Results with an initial invested capital of 100 euros.
cBot
NAS100
NZDUSD
Martingale
+26
ElliottWave Pro cBot
The Elliott Wave Pro Bot is a sophisticated and highly configurable algorithmic trading system
cBot
NAS100
NZDUSD
Martingale
+26
Prop Ready Bot v2.0 Trial 7days
The Prop-Ready Bot The Definitive Automaton for Challenges πŸ›‘οΈ V2.0
cBot
Grid
NAS100
RSI
+14
Multi TimeFrame Dominator
Dominate EMA structure across multiple timeframes – with trend, risk and equity under control.
Indicator
NAS100
NZDUSD
Martingale
+26
Volume Bubble
Volume Bubbles is a lightweight yet powerful visual indicator for cTrader
Indicator
Grid
NAS100
NZDUSD
+18
Zig Zag ATR
ZigZag Pro β€” Advanced swing detection with ATR threshold, fractal confirmation, and colored segments. Clean market
You may also like
Indicator
NAS100
Breakout
XAUUSD
+12
VWAP & Sessions & D,W,M HLO Levels
Killzone Session With VWAP – Precision Meets Price Action
Indicator
Indices
Forex
EURUSD
+2
US Dollar Index
US Dollar Index
[Stellar Strategies] Inside Bar with Signals
Visually master the Inside Bar strategy with clear breakout signals and professional chart highlighting πŸ“ˆπŸ””πŸ“‰
Indicator
Indices
Prop
Stocks
+3
Nadaraya-Watson Kernel Regression
Ultra-smooth adaptive trend line via Gaussian kernel regression β€” low lag, clean structure.
Pips V4Final
Displays pips from daily open with high/low. Clean, customizable, perfect for quick daily price context.
MM-Symbol Info (free)
Enhance the trading experience with real-time Spread, Time To Close, rPNL, uPNL, PNL and minimalistic Bid / Ask lines
Indicator
RSI
Breakout
XAUUSD
+5
Zones Supply Demand
πŸ“ŠZones Supply & Demand: Identifies key price levels with high volume concentration, marking Supply/Demand Zones & Marke
Indicator
NAS100
NZDUSD
Breakout
+13
KeyLevels
Key Levels Indicator – Automatically plots monthly, weekly, and daily highs/lows with customizable colors & styles
Indicator
NAS100
NZDUSD
XAUUSD
+10
Market Structure Shift
Market Structure Shift – Professional Market Structure Oscillator
Indicator
Martingale
Forex
Fibonacci
+24
Smart Floating Risk-Utimate version
πŸ“Š Smart Floating Risk Ultimate.Transform Your Risk Management with Real-Time Intelligence.
Indicator
Stocks
Commodities
Forex
buy sell
SmartSignal Pro: Precise BUY/SELL signals to profit in any market. Trade like a pro! πŸš€
Indicator
Breakout
AI
Scalping
KaufmanEfficiencyRatio
A precision tool for measuring how efficiently price moves from point A to B.
Indicator
NAS100
NZDUSD
Breakout
+12
Multi_TF Candlestick Chart Overlay
Perfect for traders who demand a clear overview of multiple timeframes at a glance.
Indicator
NAS100
RSI
NZDUSD
+18
Market Cipher A
Market Cipher A
Multi Volume Profile
Advanced customizable volume-profile indicator with buy/sell levels, delta analysis, multi-TF support and vivid gradient
Time Marker
CaptraTimeMarker: Marks key trading hours with lines & labels, plus daily separators for cTrader. Customizable & precise
Renko Wicks
Renko Wicks
Indicator
Indices
ATR
Stocks
+5
UT Bot Alerts Nova
UT Bot Alerts Nova: Advanced trend-following indicator using ATR for signals. Precise entries/exits.