
Description
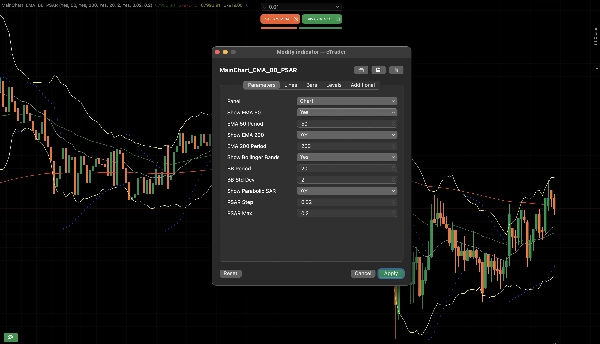
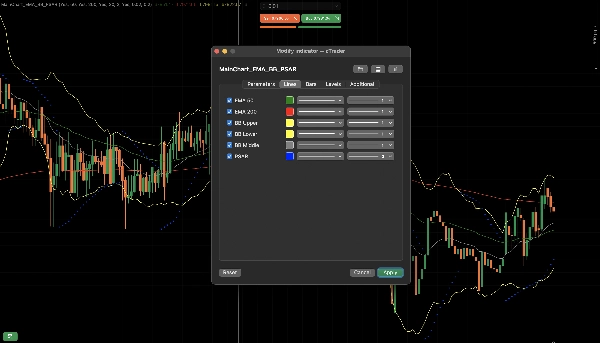
MainChart_EMA_BB_PSAR
How It Works
1. Core Concept
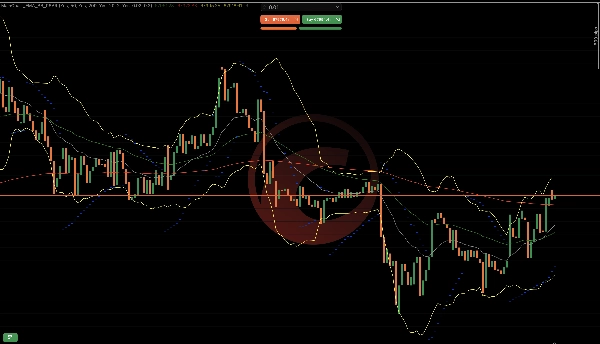
This indicator combines trend, volatility, and momentum continuation logic into one overlay:
EMA 50 & EMA 200 → Trend direction
Bollinger Bands → Volatility & expansion
Parabolic SAR → Trend continuation & reversal timing
Each component serves a specific function. Together, they form a structured decision framework.
2. EMA Logic (Trend Engine)
What It Does
Calculates exponential averages of closing prices.
EMA 50 reacts faster.
EMA 200 reacts slower.
How It Interprets Market
Condition Meaning
EMA 50 above EMA 200 Bullish trend
EMA 50 below EMA 200 Bearish trend
EMA 50 crosses EMA 200 Possible trend shift
Why It Works
EMA smooths price and filters noise.
The 50/200 relationship shows short-term momentum relative to long-term direction.
3. Bollinger Bands Logic (Volatility Engine)
What It Does
Calculates moving average (middle band)
Builds upper/lower bands using standard deviation
How It Interprets Market
Condition Meaning
Bands narrow Low volatility (compression)
Bands expand High volatility (strong move active)
Price touches outer band Potential overextension
Why It Works
Markets cycle between compression and expansion.
Breakouts often happen after volatility contraction.
4. Parabolic SAR Logic (Continuation Engine)
What It Does
Plots dots above or below price.
Accelerates as trend continues.
How It Interprets Market
Dot Position Meaning
Below price Uptrend active
Above price Downtrend active
Dot flips Possible reversal
Why It Works
PSAR tightens as trend matures, helping trail moves and detect exhaustion.
5. How All Components Work Together
Bullish Structure
EMA 50 above EMA 200
Price above EMA 50
PSAR below candles
Bollinger Bands expanding upward
→ Indicates strong upward momentum
Bearish Structure
EMA 50 below EMA 200
Price below EMA 50
PSAR above candles
Bollinger Bands expanding downward
→ Indicates strong downward momentum
6. Market Phase Detection
This indicator helps identify 3 market phases:
Trending Phase
EMA aligned
PSAR consistent
Bands expanding
Best for continuation trades.
Compression Phase
Bands tight
EMA flat
PSAR flipping frequently
Best to wait for breakout.
Transition Phase
EMA cross forming
PSAR flip
Bands widening
Potential early reversal.
7. Practical Flow Example
Example bullish sequence:
Bands squeeze
Strong bullish candle breaks upper band
EMA 50 crosses above EMA 200
PSAR flips below price
This sequence shows:
Volatility expansion
Trend confirmation
Continuation support
8. What It Does NOT Do
Does not predict news
Does not guarantee reversals
Does not measure order flow
Does not eliminate false breakouts
It provides structured confirmation, not certainty.
9. Summary Logic Model
Trend Filter → EMA
Volatility Trigger → Bollinger Bands
Timing & Trail → Parabolic SAR
Together, they reduce random entries and improve structured decision-making.
Good about this indicator is configurable and No need to setup multiple indicators.
Summary
1. Exponential Moving Averages (EMA 50 and EMA 200) to determine trend direction—EMA 50 reacts faster to price changes, while EMA 200 provides a longer-term trend perspective. The relative position of these EMAs signals bullish or bearish trends and potential trend shifts.
2. Bollinger Bands to measure market volatility and detect phases of compression (low volatility) and expansion (high volatility). Narrow bands indicate potential breakout setups, while price touching outer bands suggests possible overextension.
3. Parabolic SAR to identify trend continuation and reversal timing by plotting dots above or below price, signaling active uptrends or downtrends and potential reversals when dots flip position.
Together, these components form a structured decision framework that helps identify market phases—trending, compression, and transition—and supports confirmation of trend strength and momentum. The indicator is configurable and designed to reduce random entries by combining trend filtering, volatility triggers, and timing signals. It is applicable across various markets including Forex, cryptocurrencies, stocks, commodities, and indices. This tool provides structured confirmation for trading decisions but does not predict news events, guarantee reversals, or eliminate false breakouts.
Customer reviews
5 | 50 % | |
4 | 50 % | |
3 | 0 % | |
2 | 0 % | |
1 | 0 % |


