"fractal_high_low" logo
Indicator
111 downloads
Version 1.1, Apr 2026
Windows, Mac
"fractal_high_low" uploaded image
Since 20/09/2025
69.48M
Traded volume
372.7K
Pips won
111
Free installs

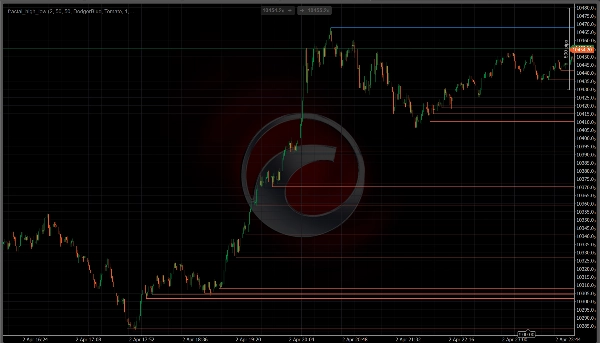
If you trade price action, you already know that the most

important levels on any chart are fractal highs and lows β€”

the swing points where price rejected, reversed, or broke

structure. Frac High Low Lines finds those points for you

and draws them automatically, so you can focus entirely on

reading price rather than managing drawings.


──────────────────────────────────────────────────────────

HOW IT WORKS

──────────────────────────────────────────────────────────


The indicator uses classic Williams fractal logic to confirm

pivot points. A fractal high is only valid when its high is

strictly greater than the surrounding bars on both sides. A

fractal low is only valid when its low is strictly lower.

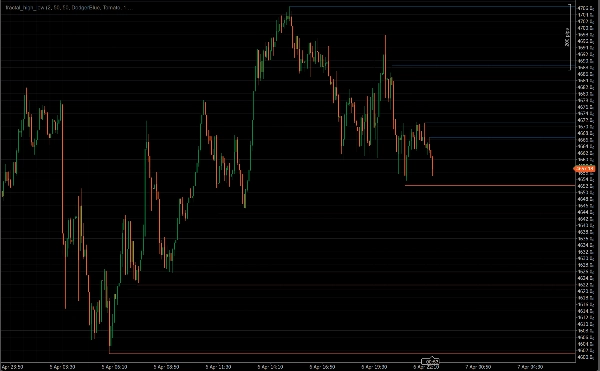
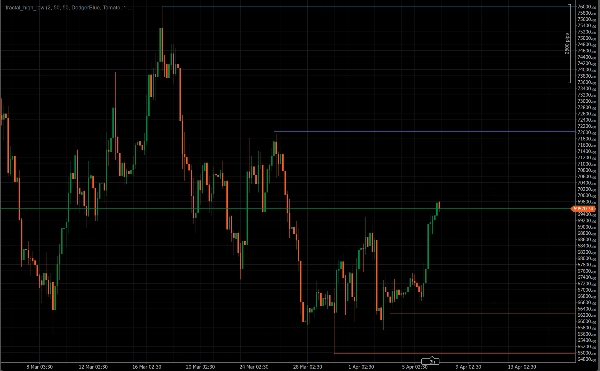
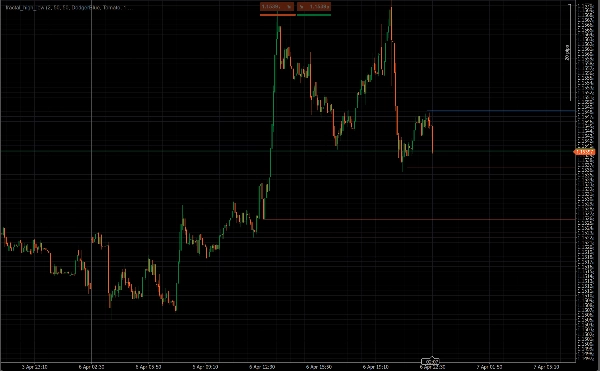
Once confirmed, a horizontal line is drawn from that pivot

and extended forward β€” giving you a clear visual reference

for every significant structural level on the chart.


No repainting. Fractals are only confirmed after enough bars

have closed on both sides, so levels never appear and

disappear as price moves.


──────────────────────────────────────────────────────────

KEY FEATURES

──────────────────────────────────────────────────────────


β€’ Auto fractal detection β€” scans all bars on load, then

updates in real time as new bars form


β€’ Configurable fractal period β€” use period 2 for every

minor swing, or increase it to isolate only the major

structural highs and lows


β€’ Max lines control β€” independently limit how many

resistance and support lines show at once, keeping your

chart clean and focused on recent structure


β€’ Broken level removal β€” optionally auto-removes a line

when price closes through it, so only unbroken levels

remain visible


β€’ Full visual control β€” set color, thickness, and line

style (Solid, Dash, Dot) independently for highs and

lows


β€’ Lightweight β€” each line is drawn once and never redrawn,

so performance stays smooth even on M1 or M5 charts


──────────────────────────────────────────────────────────

WHO IT IS FOR

──────────────────────────────────────────────────────────


Built specifically for price action traders who use swing

highs and lows to identify structure, plan trade entries,

set stop losses, and spot potential reversal or breakout

zones. Works on any symbol and any timeframe in cTrader.


──────────────────────────────────────────────────────────

FREE β€” NO STRINGS ATTACHED

──────────────────────────────────────────────────────────


Frac High Low Lines is completely free. Install it, add it

to your chart, and trade with cleaner structure levels from

your very first session.


==========================================================

Indicator profile
Indicator category
Market structure (SMC)
Output type
Signals
Visualisation
Data requirements
Bars only
Supported signals
Level touch
Level break
0.0
Reviews: 0
Customer reviews
No reviews for this product yet. Already tried it? Be the first to tell others!
BTCUSD
Prop
Forex
Scalping
Indices
EURUSD
Commodities
Crypto
Stocks
XAUUSD
NAS100
Products available through cTrader Store, including trading bots, indicators and plugins, are provided by third-party developers and made available for informational and technical access purposes only. cTrader Store is not a broker and does not provide investment advice, personal recommendations or any guarantee of future performance.

You may also like

Indicator
Forex
Crypto
+3
Detect powerful 2-candle reversal patterns at key highs/lows. Boost entries with real-time alerts and visual signals.
Indicator
Prop
Forex
+4
A comprehensive workflow‑enhancement toolkit designed to make charting on cTrader smoother, clearer, and more efficient.
Indicator
MACD
Key Levels
+2
Trend indicator with multi-timeframe filters, generating signals only on fully completed bricks & candles. No Repaint.
Indicator
VWAP
Volume
+5
The MA Quant Volume Profile Custom Range is a trading indicator that analyzes volume distribution across the price.
Indicator
Key Levels
Supply & Demand
+2
Institutional Levels Pro is an essential tool for traders who rely on price action and institutional market structure.
Indicator
Forex
Crypto
+1
Super Arrows
Indicator
Signal
Trades Opening Range Breakouts Indicator with dynamic stops/targets adapting to market volatility.
Indicator
Forex
Indices
+1
Professional Fair Value Gaps with multitimeframe spot on
Indicator
Key Levels
Market Structure
Economic calendar news directly on the chart.
Indicator
AI
ATR
+12
The standard Relative Strength Index (RSI), RSI & Signal Cloud, Smart Volatility Filter (ATR), On-Chart Info Dashboard
Indicator
BOS
Volume
+5
Stop guessing. Use Institutional Level 2 Depth Of Market Data to make informed decisions on the direction of the markets
Indicator
VWAP
Renko Wicks
Indicator
Bollinger
Jurik Moving Average (Jurik's Moving Average) triple adaptive filter with unique Jurik smoothing and dynamic factor.
Indicator
SMC
Prop
+14
Right-anchored cTrader Volume Profile with VAH/VAL/POC, LVZ, top volume+EMA, themes, and fast, readable visuals.
Indicator
AI
ATR
+27
Market Cipher B
Indicator
Forex
BTCUSD
+4
The Linear Regression Oscillator (LRO) is a technical indicator based on linear regression analysis.
Indicator
AI
ATR
+20
Algorithmic trend precision for cTrader.
Indicator
Liquidity Grab
Liquidity Sweep
+1
CRT Sweep Tracker is an advanced panel for Candle Range Theory (CRT) traders to track HTF sweeps and manage live trades.
Since 20/09/2025
69.48M
Traded volume
372.7K
Pips won
111
Free installs