present
Sign up and get $50 off your first purchase
Trading product for Correlation Meter Indicator Premium/Discount  RSI, image 1
Correlation Meter
Indicator
Version 1.0, Apr 2026
Windows, Mac
Trading product for Correlation Meter Indicator Premium/Discount  RSI, image 2
Trading product for Correlation Meter Indicator Premium/Discount  RSI, image 3
12.28M
Traded volume
31.27K
Pips won

Description

Track correlation divergences before the market corrects.

Most traders know that XAUUSD and DXY move inversely. Or that XAUUSD and XAGUSD tend to move together. What they don't have is a tool that tells them when that relationship breaks down and what to do about it.

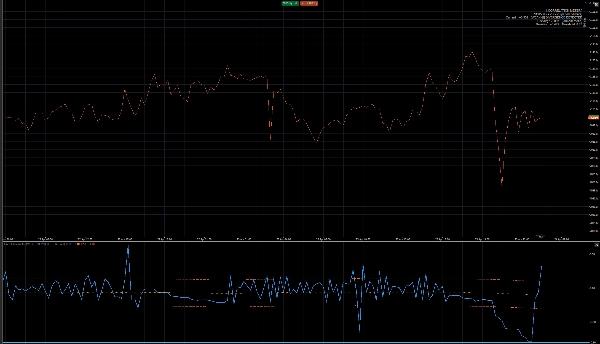
Correlation Meter calculates a live Pearson correlation coefficient between any two symbols using log-returns (the statistically correct input for financial data). It then compares that short-term reading against a longer historical average and fires an alert the moment the gap becomes significant.

How it works

The indicator opens in a sub-window below your chart, similar to RSI. A blue line shows the current 50-bar correlation. An orange dotted line shows the 200-bar historical average. Two red bands mark the divergence threshold. When the blue line breaks outside those bands, the correlation between your two symbols has shifted beyond its normal range meaning one symbol has lagged behind the other and a statistical reversion is probable.

A colour-coded overlay panel in the corner of your chart shows correlation strength at a glance: from Very Strong (≥0.90) down to None (<0.30).

Risk warning

If you hold two highly correlated positions open at the same time. For example XAUUSD long and XAGUSD long with a +0.93 correlation the indicator flags a red warning that your actual risk exposure is nearly double what it appears. Two positions are not two separate bets if they move as one asset.

Pre-configured pairs

Works with any two symbols your broker offers. Suggested starting pairs: XAUUSD/DXY, XAUUSD/XAGUSD, USOIL/USDCAD, EURUSD/DXY, SPX500/VIX.

Parameters

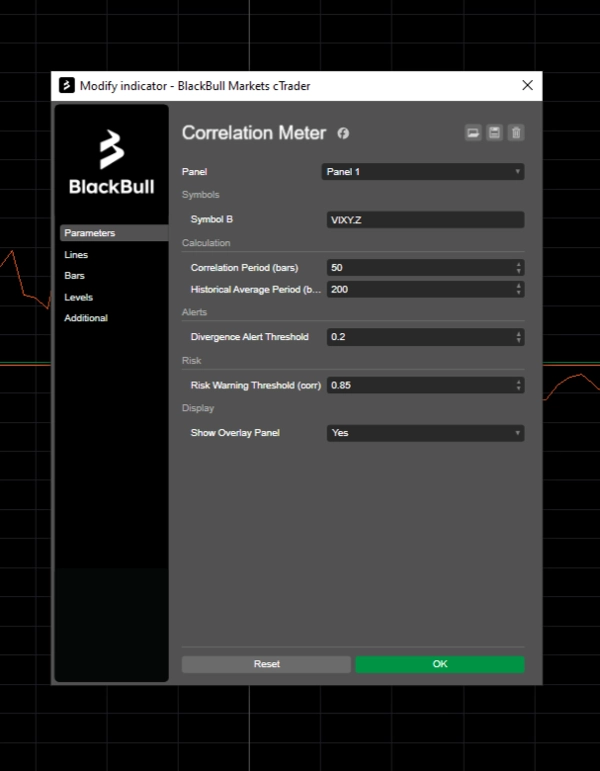
All key settings are adjustable: correlation period, historical average period, divergence threshold, and risk warning sensitivity. No coding required.

Summary

Indicator profile
Indicator category
Statistics
Output type
Signals
Data requirements
Bars only
Supported signals
Divergence
Trend strength

Discussion

Customer reviews

0.0
Reviews: 0
Customer reviews
No reviews for this product yet. Already tried it? Be the first to tell others!

FAQ

Premium/Discount
RSI
Imbalance
Market Structure
Products available through cTrader Store, including trading bots, indicators and plugins, are provided by third-party developers and made available for informational and technical access purposes only. cTrader Store is not a broker and does not provide investment advice, personal recommendations or any guarantee of future performance.

More from this author

Indicator
Prop
Forex
+11
Detects revenge trades in real time and shows exactly how much they've cost you, before the next one makes it worse.

You may also like

Indicator
VWAP
Moving Average
Vwap Bands it is highly sought after by professional traders because it includes Standard Deviation Bands
Indicator
ATR
VWAP
+4
Structure-aware indicator that re-anchors VWAP to confirmed swing pivots.
Indicator
AI-assisted
Order Block
+5
The daily bias estimator indicator uses ICT concepts to show whether the chart is bullish or bearish on multi-time frame
Indicator
ADX
ATR
+2
GOLD SENTINEL v1.0 - A CANDLE-COLORING INDICATOR FOR GOLD.
Indicator
Inside Bar
Save time by lighting a candle to look within yourself in another temporality
Indicator
ATR
Flag
+5
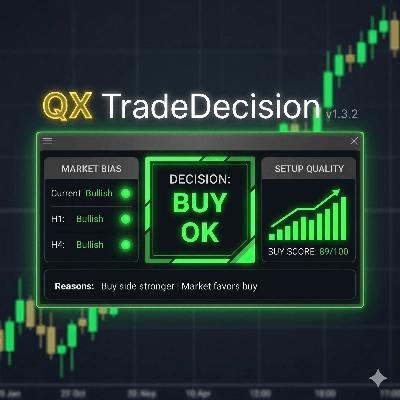
Decision panel with Buy/Sell scores, market bias, setup quality, trading cost and clear trade reasons.
Indicator
BOS
CHOCH
+5
A professional-grade cTrader indicator for traders following the Inner Circle Trader (ICT) methodology.
Indicator
Forex
EURUSD
+7
Institutional Session Levels Pro OHLC,Prev(D,W,M OHLC)
Indicator
VWAP
Forex
+5
Trade with institutional accuracy. Identify fair price levels and high-volume zones instantly!
Indicator
BOS
EMA
+5
VWAP Bands indicator with 3 standard deviation levels, buy/sell zones, and a draggable ON/OFF button to toggle the entir
Indicator
Market Structure
Support & Resistance
Auto-centers price when it moves beyond threshold. Adjustable zoom. Works on any chart type. Never lose price again.
Indicator
AI
Grid
+17
BORIS Easy Trend: Relax & scalp with 6-TF alignment. Clear BUY/SELL signals & movable UI/HUD make trading effortless.
Indicator
Drawdown Monitor
Protect your funded account. Real-time Daily Equity Drawdown monitor with Green / Orange / Red flashing alerts.
Indicator
Indices
Breakout
+1
You can use the cTrader Pivot Points Pro indicator to find a good pullback entry in a trend
Indicator
AI
SMC
+9
Identifies market trends (-10 to +10) using HMA with volume confirmation. Includes customizable alerts.
Indicator
Forex
Indices
+1
Professional Fair Value Gaps with multitimeframe spot on
Indicator
Forex
Signal
+4
Gann Pivot Vision is an innovative analytical tool that combines classic pivot reversal levels and Gann geometry
Indicator
SMC
Forex
+5
Pinpoint FVGs, track fills and see mitigation stats — trade imbalances with clarity and confidence.

Price

12.28M
Traded volume
31.27K
Pips won