

CycleFrecuencyProV1
Indicator
Version 1.0, May 2026
Windows, Mac
5.0
Reviews: 2
Since 18/12/2025
Description
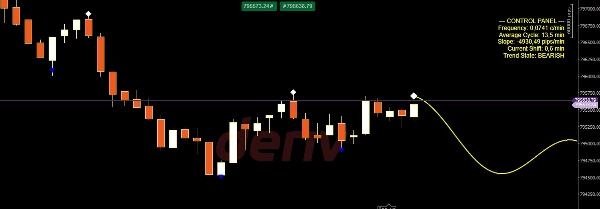
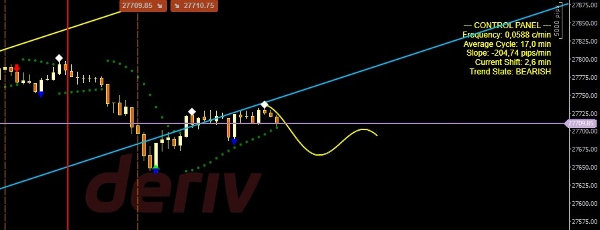
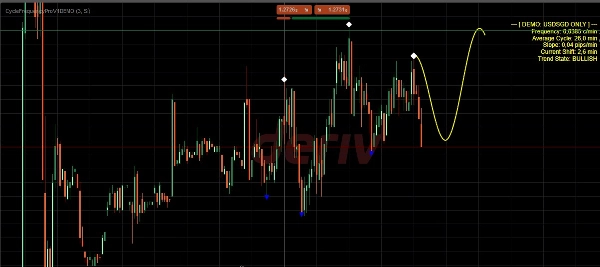
Sync Your Trading with Market Frequency Tired of lagging indicators? Most traders fail because they ignore the temporal dimension of the market. Cycle Frequency Pro V1 changes the game, allowing you to project future price action based on historical cycles and real-time frequency analysis.
What makes this indicator unique? While automated algorithms often break during volatility, Cycle Frequency Pro gives you the control. By manually identifying key structural peaks and valleys, you provide the "human edge" that the indicator transforms into a precise mathematical model. It instantly calculates frequency, slope, and phase shifts to visualize the next high-probability wave.
Key Features:
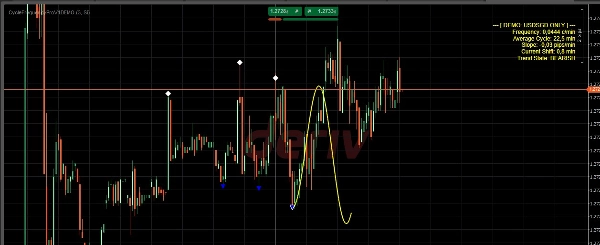
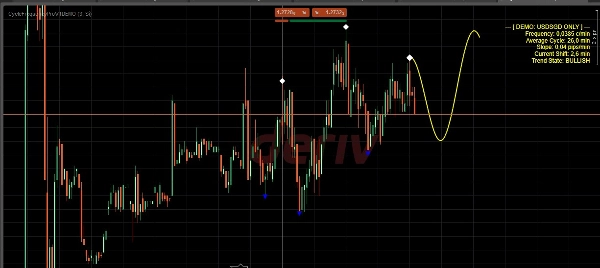
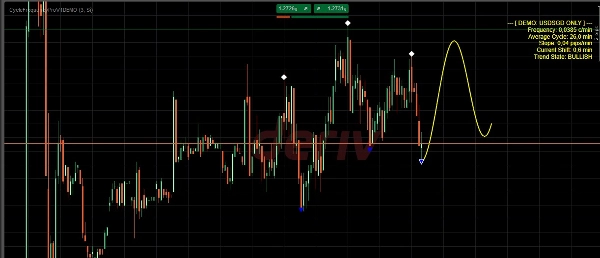
- Dynamic Sine Wave Projection: Visualize the most probable price trajectory across the time axis.
- Professional Control Panel: Real-time data including Frequency (c/min), Average Cycle, and Pip Slope.
- Precision Geometric Engine: Optimized for ultra-smooth rendering and vertex accuracy.
- Cross-Market Versatility: Engineered specifically for the 24/7 fluidity of Synthetic Indices, while maintaining peak performance in Forex, Commodities, and Metals.
Quick Start:
- Align the diamonds (peaks) and triangles (valleys) with the most recent structural turning points.
- The wave automatically synchronizes with the price slope and rhythm.
- Execute trades where the projected wave aligns with your institutional zones.
Summary
AI summary
CycleFrecuencyProV1 is a market timing indicator designed to forecast price rhythms using an interactive sine wave projection based on historical cycles and real-time frequency analysis. It enables traders to manually mark key structural peaks and valleys, which the indicator then uses to calculate frequency, slope, and phase shifts, projecting the most probable future price trajectory.
Key features include a dynamic sine wave visualization aligned with the time axis, a professional control panel displaying real-time metrics such as frequency (cycles per minute), average cycle length, and pip slope, and a precision geometric engine optimized for smooth rendering and accurate vertex placement. The indicator is engineered for versatility across multiple markets, including Synthetic Indices with 24/7 trading, Forex, Commodities, and Metals.
To use, traders align the indicator’s markers with recent structural turning points, allowing the wave to synchronize automatically with current price rhythm. This projection can then be used to identify high-probability trade entries in conjunction with institutional zones. The indicator supports visualization, signal generation for reversals, level touches, trend strength, and divergence, and requires bar or tick data for analysis. It is categorized under market structure indicators.
Key features include a dynamic sine wave visualization aligned with the time axis, a professional control panel displaying real-time metrics such as frequency (cycles per minute), average cycle length, and pip slope, and a precision geometric engine optimized for smooth rendering and accurate vertex placement. The indicator is engineered for versatility across multiple markets, including Synthetic Indices with 24/7 trading, Forex, Commodities, and Metals.
To use, traders align the indicator’s markers with recent structural turning points, allowing the wave to synchronize automatically with current price rhythm. This projection can then be used to identify high-probability trade entries in conjunction with institutional zones. The indicator supports visualization, signal generation for reversals, level touches, trend strength, and divergence, and requires bar or tick data for analysis. It is categorized under market structure indicators.
Indicator profile
Indicator category
Market structure (SMC)
Output type
Visualisation
Signals
Filter
Data requirements
Bars only
Tick data
Supported signals
Reversal
Level touch
Trend strength
Divergence
Customer reviews
5.0
Reviews: 2
5 | 100 % | |
4 | 0 % | |
3 | 0 % | |
2 | 0 % | |
1 | 0 % |
Discussion
FAQ
RSI
Order Block
Market Structure
Supply & Demand
Channel
Liquidity Grab
Support & Resistance
Products available through cTrader Store, including trading bots, indicators and plugins, are provided by third-party developers and made available for informational and technical access purposes only. cTrader Store is not a broker and does not provide investment advice, personal recommendations or any guarantee of future performance.
More from this author















Price
Since 18/12/2025