present
Sign up and get $50 off your first purchase
Trading product for MtfCandleLite Indicator Support & Resistance, image 1
MtfCandleLite
Indicator
Version 1.0, May 2026
Windows, Mac
Trading product for MtfCandleLite Indicator Support & Resistance, image 2
Trading product for MtfCandleLite Indicator Support & Resistance, image 3
Trading product for MtfCandleLite Indicator Support & Resistance, image 4
Trading product for MtfCandleLite Indicator Support & Resistance, image 5
Since 09/05/2026

Description

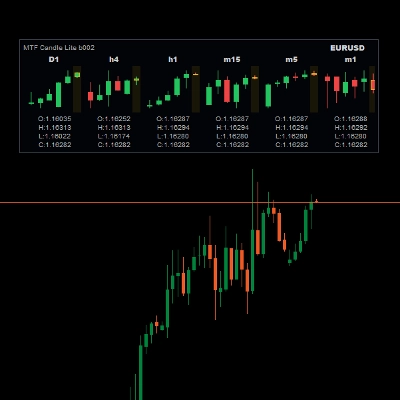
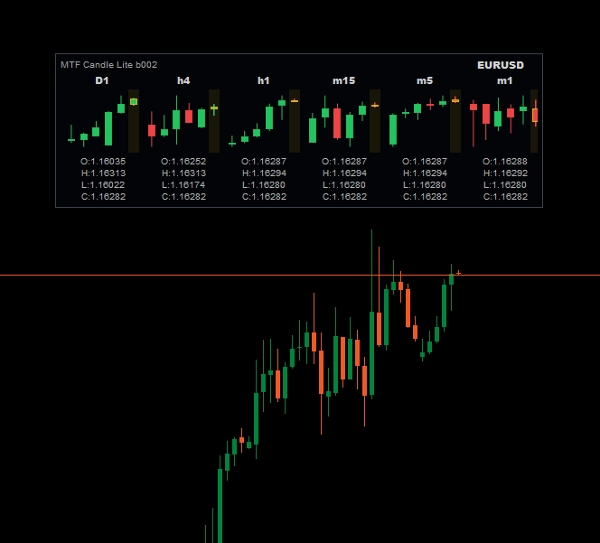
MTF Candle Lite is a lightweight multi-timeframe candle panel for cTrader. It displays mini candles from up

to six selected timeframes in a compact horizontal layout, helping traders check higher-timeframe and

lower-timeframe candle direction without opening multiple charts.


The indicator is designed for discretionary traders who want quick visual context before making their own

trading decisions. It does not open trades, does not generate automatic entry signals, and does not use

account or trading permissions.


Key features:


- Displays up to six timeframes in one compact panel.

- Supports standard timeframes and tick-based timeframes.

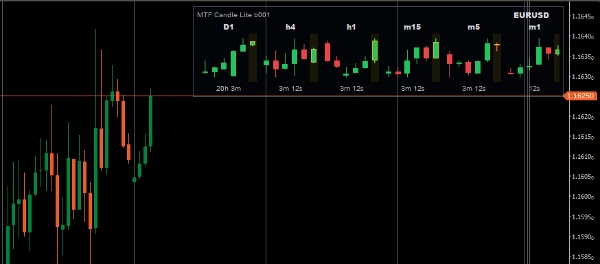
- Shows the current live candle together with recent closed candles.

- Shows the remaining time until the current time-based candle closes.

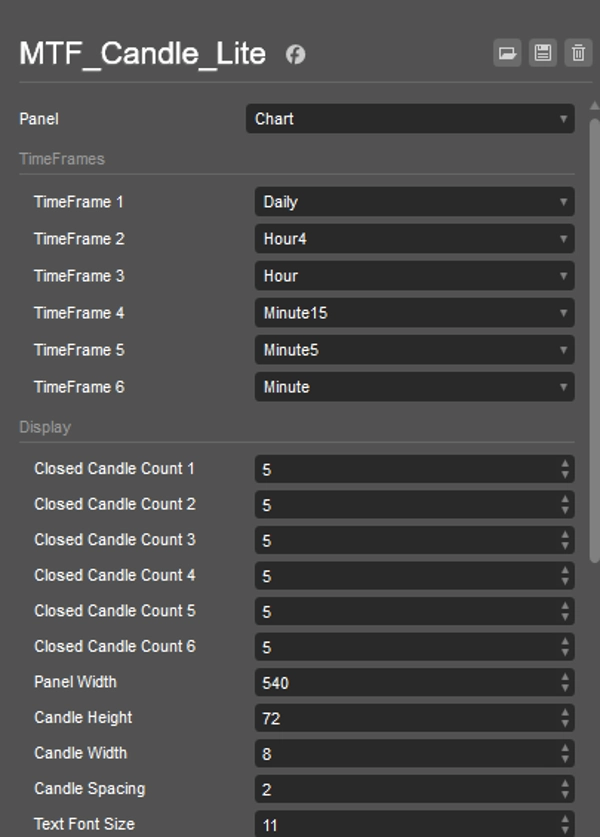
- Lets you set the number of closed candles for each timeframe.

- Uses clear bullish, bearish and live-candle colors.

- Includes optional OHLC text display.

- Keeps the panel fixed and simple for stable daily use.


Indicator type: Multi-timeframe candlestick visualisation.


Preferred instruments: Major forex pairs, metals, indices and other liquid symbols available in cTrader.


Preferred periods: Useful for intraday and swing-trading chart setups, especially when combining lower

periods such as m1, m5 or m15 with higher periods such as h1, h4 and d1.


Trading use cases:


- Quickly compare candle direction across multiple timeframes.

- Check whether higher-timeframe candles support or conflict with the current chart view.

- Keep a compact multi-timeframe overview visible while focusing on the main chart.

- Use as a visual confirmation tool alongside your own strategy, trend analysis or price-action rules.


Important limitations:


- This free version does not save or restore panel coordinates.

- The previous display position is not guaranteed after parameter changes, chart changes, template reloads,

indicator removal and re-adding, or cTrader restart.

- Running multiple instances of this indicator on the same chart is not supported or guaranteed.

- This indicator is a visual analysis tool only. It does not provide financial advice or guaranteed trading

results.


Trading involves risk. Past performance does not guarantee future results.
Summary

Indicator profile
Indicator category
Trend
Output type
Visualisation
Data requirements
Bars only

Discussion

Customer reviews

0.0
Reviews: 0
Customer reviews
No reviews for this product yet. Already tried it? Be the first to tell others!

FAQ

Support & Resistance
Products available through cTrader Store, including trading bots, indicators and plugins, are provided by third-party developers and made available for informational and technical access purposes only. cTrader Store is not a broker and does not provide investment advice, personal recommendations or any guarantee of future performance.

You may also like

Indicator
ATR
RSI
+5
Binary Options Signals Pro – Precision Trading at Your Fingertips
Indicator
Forex
Alerts you when price touches Fibonacci levels. Stay organized and trade efficiently!
Indicator
Prop
BTCUSD
+8
A next‑generation moving average designed to deliver exceptional smoothness with minimal lag.
Indicator
Grid
Prop
+5
Logarithmic Framework by LudwigICT
Indicator
RSI
EURUSD
+2
It identifies areas of market imbalance (Fair Value Gaps or FVGs) and projects them on the chart in a smart way
Indicator
Key Levels
Support & Resistance
Day and week separators plus previous day high, low and close lines for every day on H1 and lower charts
Indicator
This indicator is a valuable tool for traders looking to identify significant opening price level of any asset.
Indicator
Doji
Engulfing
+1
Mide en puntos la distancia entre el Máximo y el Mínimo alcanzados por cada vela, incluida la vela actual.
Indicator
CandleColourFlow MultiFx - optimized to work on Fx Majors, Fx MInors, Fx Crosses
Indicator
AI
ATR
+10
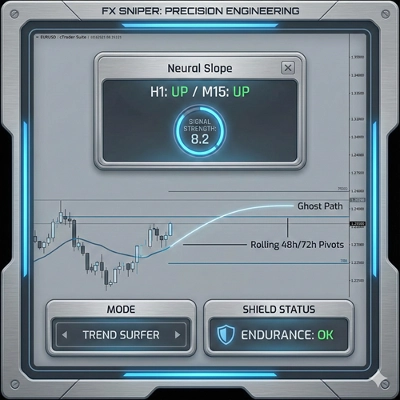
FX Sniper: Multi-pair Forex analysis tool. Features trend logic, adaptive pivots, and momentum filtering for major pairs
Indicator
ATR
RSI
+6
📊Zones Supply & Demand: Identifies key price levels with high volume concentration, marking Supply/Demand Zones & Marke
Indicator
RSI
BTCUSD
+5
🚀 Auto-detects support/resistance & trend channels! Saves time ⏳, spots key levels 🔍
Indicator
Volume
Fibonacci
+3
Draw and manage multiple fixed-range volume profiles with persistent levels, developing POC/VA and smart alerts.
Indicator
RSI
MACD
This indicator is a combination of MACD and RSI into one. This is perfect fusion and powerful indicator ever.
Indicator
Key Levels
AI-assisted
+1
Draggable candle-close countdown timer with sound alert. Works on any timeframe and symbol. Cloud & Desktop ready.
Indicator
Forex
Indices
+5
Market Profile TPO for cTrader — full auction logic, IB, POC, VA zones, histogram and O/X markers with time
Indicator
AI
RSI
+7
Multi-asset screener with real-time RSI/volatility analysis, interactive dashboard, and color-coded trading signals.
Indicator
Forex
BTCUSD
+8
The traditional Hull Moving Average with different colours based on the slope (direction) of the trend.

Price

Since 09/05/2026