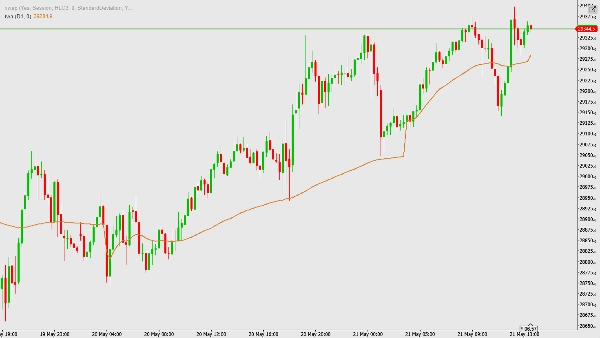
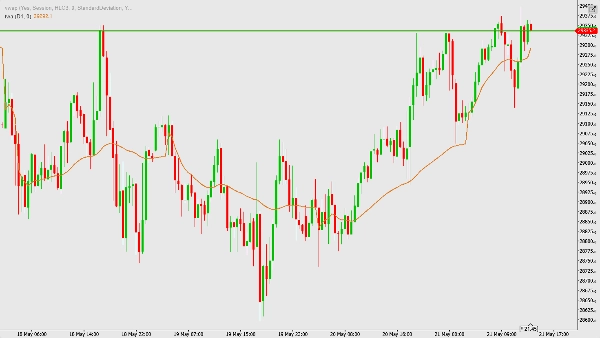
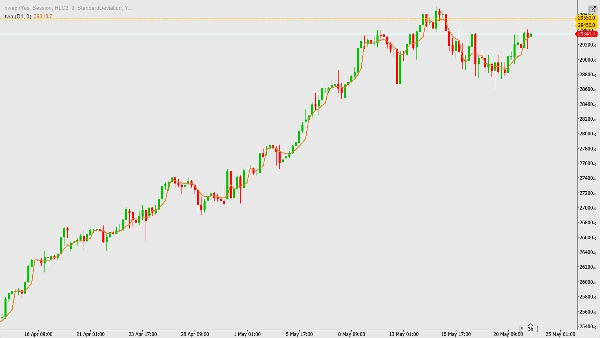
Description
Time Weighted Average Price (TWAP) Intraday Anchor
Overview
The Time Weighted Average Price (TWAP) indicator is a premium execution and directional filter designed to mirror institutional market tracking benchmarks. Unlike standard retail indicators that are heavily skewed by sudden, brief volume spikes, TWAP calculates the true mathematical average price of an asset distributed evenly across time.
By tracking price progression purely relative to structural time boundaries (such as the daily session open), this indicator strips out systemic algorithmic noise. It provides retail day traders, scalpers, and systematic algorithmic developers with a clear view of the intraday trend direction and institutional fair value.
Key Features
- Institutional Benchmark Alignment: Tracks the exact execution benchmark used by high-frequency trading (HFT) desks, investment bank execution algorithms, and large institutional fund managers to deploy size without moving the market.
- True Intraday Anchoring: Dynamically resets its cumulative mathematical metrics precisely at the transition threshold of your selected higher-timeframe anchor period (e.g., Daily Session Open, Weekly boundary, or custom Intraday blocks).
- Mathematical Purity (
OHLC4Source): Uses the structural mid-point of every individual bar by calculating the average of the Open, High, Low, and Close prices. This completely sanitizes the data from anomaly spikes or thin liquidity slippage. - Fully Formatted Visual Customization: Built explicitly with native cTrader UI standards, offering configurable plot color matching (
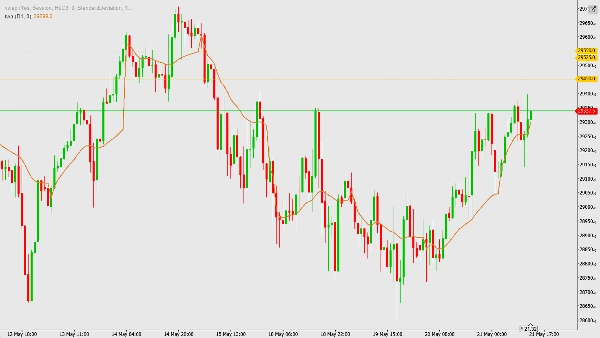
#DD7A28), plot style properties, and precise horizontal plotting offsets.
How it Works: The Underlying Mechanics
Standard indicators like Exponential Moving Averages (EMA) use a fixed trailing lookback period (e.g., 20 bars). This creates structural lag and causes indicators to dynamically alter their history when jumping across timeframes.
TWAP functions using an entirely different mathematical approach:
- Anchor Identification: At the start of a new anchor cycle (e.g., a new trading day), the internal script memory resets its trackers to absolute zero.
- Cumulative Time Weighting: As each lower-timeframe bar prints (e.g., a 1-minute, 5-minute, or tick chart), the script captures the current
OHLC4price. - The Equation: The script continuously computes the running arithmetic mean of these prices over the session:
TWAP=n∑i=1nPricei
Where Pricei represents the OHLC4 value of bar i, and n is the total cumulative count of bars elapsed since the current anchor period commenced.
echnical Specifications & Inputs
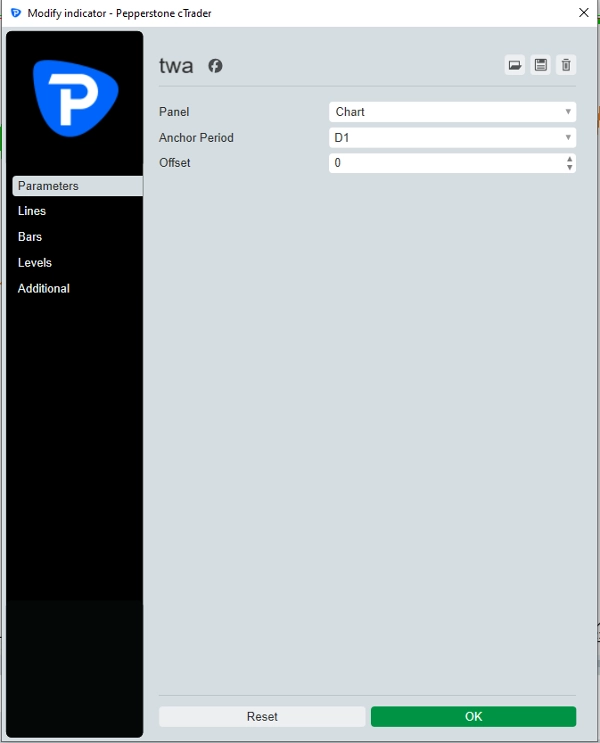
Anchor Period
- Default Value: Daily
- Type: TimeFrame Selection
- Description: The structural timeframe macro boundary that triggers the internal data reset. Supports Daily, Weekly, Monthly, 4-Hour, and 1-Hour periods.
Offset
- Default Value: 0
- Type: Integer
- Description: Shifts the resulting indicator line plot forward or backward along the X-axis by a specified number of bars (Hidden from display view by default).
Output Plot
- Default Value: #DD7A28 (Orange)
- Type: Line Series
- Description: High-visibility line overlay rendering the real-time calculated average price directly on your charts.