present
Sign up and get $50 off your first purchase
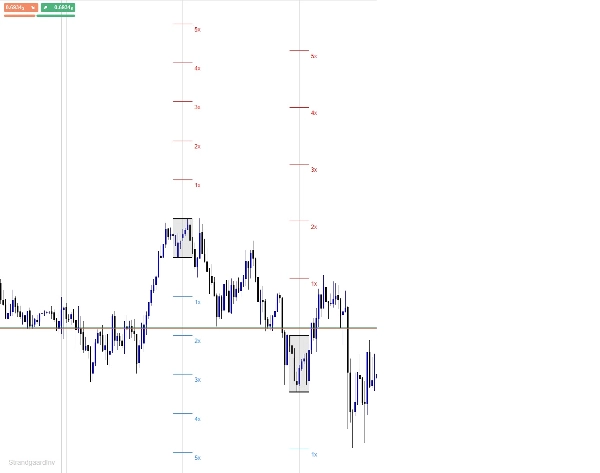
Trading product for AsianRange indikator Indicator Key Levels Market Structure, image 1
AsianRange indikator
Indicator
Version 1.0, Jul 2026
Windows, Mac
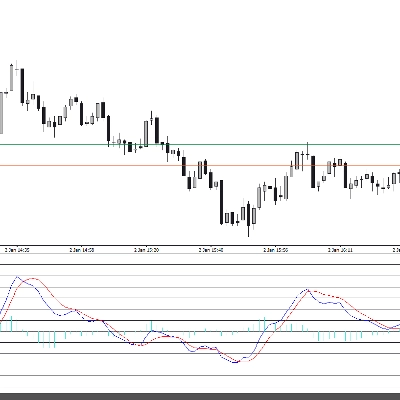
Trading product for AsianRange indikator Indicator Key Levels Market Structure, image 2
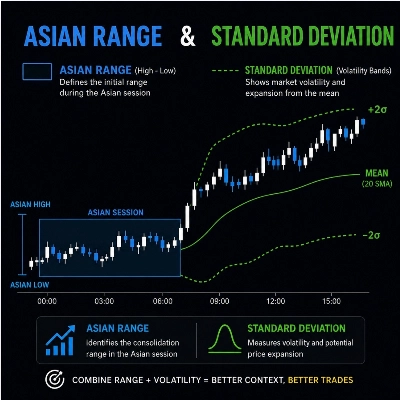
Trading product for AsianRange indikator Indicator Key Levels Market Structure, image 3
Since 19/09/2025

Description

WHAT DOES IT DO?

--------------------------------------------------------

The indicator draws the range from 8PM to 12AM

for each day for a rolling number of days back ("Days Back"),

including today (live).


For each day, it draws:

- A filled box marking the range itself (high/low)

- A horizontal line at the top of the range

- A horizontal line at the bottom of the range

- Standard deviation lines (1x to 5x, number adjustable)

above and below the range, limited to the same time width

as the range itself (not projected to the right)


Everything for a given day is automatically cleared away again when the day

falls outside your chosen "Days Back" window.


--------------------------------------------------------

IMPORTANT: TIME ZONE / DST

----------------------------------------------------------------

The start and end time of the range (default 8 PM - 12 AM)

is entered in YOUR BROKER'S SERVER TIME - not automatically in EST.


The indicator does NOT convert between EST/EDT and your

broker's server time. This means:


1. You have to find out what 20:00-00:00 EST

corresponds to on your broker's server clock (e.g. check a known

news time against your chart).


2. When the USA switches to/from daylight saving time (DST), or if

your broker's server does not follow DST,

the difference changes - then you have to update the Start/End

Hour parameters in the indicator yourself.


Standard Range window: 8:00 PM - 12:00 AM EST.


-----------------------------------------------------

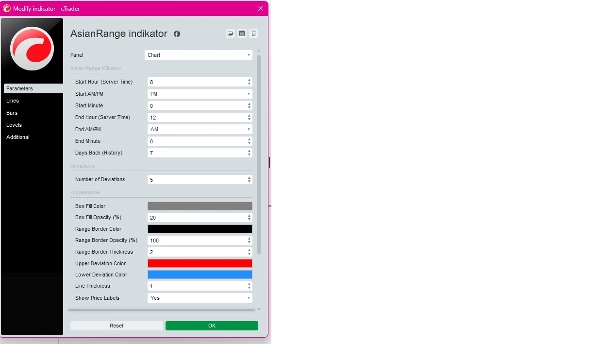
PARAMETERS

----------------------------------------------------------

8pm-12am Range Window:

Start Hour / Start AM-PM / Start Minute - start of the range (server time)

End Hour / End AM-PM / End Minute - end of the range (server time)

Days Back (History) - how many days back

are shown (0 = today only)

Deviations:

Number of Deviations - number of SD levels (1-10),

default 5

Appearance:

Box Fill Color / Box Fill Opacity (%) - color and transparency

for the range box itself

Range Border Color / Range Border Opacity - color and transparency

/ Range Border Thickness for the top/bottom lines

Upper Deviation Color - color for SD lines above the range

Lower Deviation Color - color for SD lines below the range

Line Thickness - thickness of SD lines

Show Price Labels - show/hide "1x", "2x" etc.

next to the SD lines

----------------------------------------------------------------------

KNOWN PITCH

------------------------------------------------------

If the top/bottom lines (Range Border Color) are set to a color that matches your chart background (e.g. white line on white background), they will look like they are "not being drawn" - they just lie there invisibly. Default is set to black, which suits a light/white chart theme. Change to a lighter color if you are using a dark theme.


--------------------------------------------------------

INSTALLATION

---------------------------------------------------------

1. Open cTrader -> Automate tab.

2. Create a new Indicator (or open an existing one).

3. Replace the code with the contents of the.cs file

4. Build.

5. Add the indicator to your chart via "Add algorithm".


--------------------------------------------------------

Summary

Indicator profile
Indicator category
Market structure (SMC)
Output type
Visualisation
Data requirements
Bars only
Supported signals
Session opening range

Discussion

Customer reviews

0.0
Reviews: 0
Customer reviews
No reviews for this product yet. Already tried it? Be the first to tell others!

FAQ

Key Levels
Market Structure
Products available through cTrader Store, including trading bots, indicators and plugins, are provided by third-party developers and made available for informational and technical access purposes only. cTrader Store is not a broker and does not provide investment advice, personal recommendations or any guarantee of future performance.

You may also like

Indicator
SMC
BTCUSD
+9
Detects CHoCH breakouts, draws interest zones & auto Fibo. Built for Smart Money & Price Action Engulfing confirmation
Indicator
RSI
Forex
+4
New version of one of my favorites includes Fibonacci and moving average convergence divergence lines
Indicator
Drawdown Monitor
Protect your funded account. Real-time Daily Equity Drawdown monitor with Green / Orange / Red flashing alerts.
Indicator
AI
ATR
+26
Liquidity Cluster Order automatically detects and draws accumulation zones & distribution zones
Indicator
Prop
VWAP
+5
VWAP is a powerful tool for intraday traders
Indicator
SMC
Prop
+11
Sessions PRO is a professional session visualization indicator - 4 Fully Customizable Sessions
Indicator
ATR
EMA
+5
Candle timer with live profit tracking on chart – displays pips, currency value, and percentage in real time.
Indicator
Forex
BTCUSD
+10
Enhance trading with TSI! Use the True Strength Index for clear insights into market momentum and trend strength.
Indicator
Prop
Forex
+11
⚡Nebula Range Filter is a professional trend filter indicator for cTrader⚡
Indicator
Prop
Forex
+10
IBS Indicator – Measures price position within bars for smarter trades. Works on all markets & timeframes.
Indicator
XAUUSD
Commodities
A Fair Value Gap (FVG) indicator that identifies potential price imbalances, potential reversal and continuation zones
Indicator
Forex
GBPUSD
+3
Support & resistance zones with measured hold rates and confidence intervals — evidence, not just lines on a chart.
Indicator
BOS
EMA
+5
VWAP Bands indicator with 3 standard deviation levels, buy/sell zones, and a draggable ON/OFF button to toggle the entir
Indicator
VWAP
Support & Resistance
Trading.FC$_vwap Algo shows VWAP trends, dynamic support/resistance and deviation bands to spot potential trade entries.
Indicator
Drawdown Monitor
Proprietary trading desk risk monitoring dashboard!
Indicator
ATR
Wedge
+2
Strong Supertrend Turn Market Movement into a Clear Map Market analysis
Indicator
Signal
USDJPY
See USD demand in one line—Composite OBV fuses six major FX pairs into a clear momentum gauge.
"macdZR" logo
Top-rated
4.6
(5)
$19
Indicator
MACD
Forex
+5
MACD ZERO LAG. Get faster signals, earlier trend detection, and eliminate the delay of traditional moving averages

Price

Since 19/09/2025