present
Sign up and get $50 off your first purchase
Trading product for Trend Swing Radar Indicator Key Levels Market Structure, image 1
Trend Swing Radar
Indicator
Version 1.0, Jul 2026
Windows, Mac
Trading product for Trend Swing Radar Indicator Key Levels Market Structure, image 2
Trading product for Trend Swing Radar Indicator Key Levels Market Structure, image 3
Trading product for Trend Swing Radar Indicator Key Levels Market Structure, image 4
Since 08/07/2026

Description

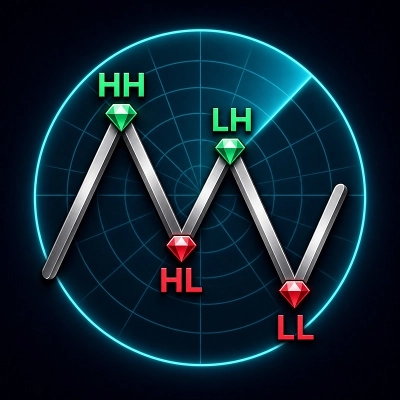
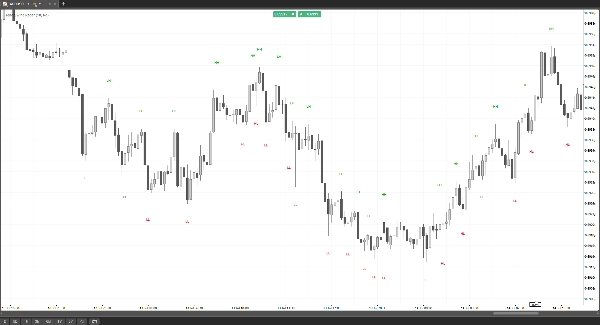
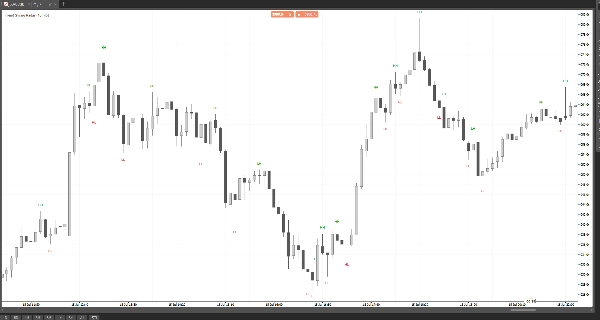
Trend Swing Radar is a visual-only indicator that dynamically follows the active price feed and identifies major Higher High (HH), Higher Low (HL), Lower High (LH) and Lower Low (LL) swing points directly on the cTrader chart.


It is intended exclusively for manual chart analysis and discretionary trading. It is not designed to provide trading signals or numerical data to cBots, automated strategies or other indicators.


Its swing and pullback engine analyses each candle price delivery directly. It does not depend on moving averages, oscillators or other lagging technical indicators to identify swings and structural changes.


Trend Swing Radar is designed for discretionary traders who want to understand price structure without lagging indicators, signal panels or unnecessary chart clutter. It prints clean labels above and below the corresponding swing points, helping traders follow bullish and bearish markets across multiple timeframes and assets.


Key features:


- Automatically identifies HH, HL, LH and LL swing structure

- Dynamically evaluates the active market data feed

- Uses direct candle price delivery instead of lagging technical indicators

- Clean label-only display with no connecting swing lines

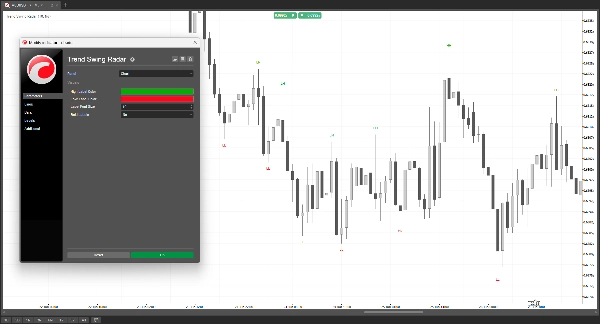
- Customizable label colors, font size and bold style

- No automated trading, alerts or numerical output series

- Intended for manual trading only; no cBot integration or machine-readable signal output

- Requires no file access, network access or Full Access permission


The indicator can be used on forex pairs, metals, indices and other instruments with reliable candle data. Typical uses include trend assessment, pullback analysis, swing identification and adding market context to an existing discretionary trading strategy.


Because the indicator follows the active price feed, developing structure on the currently forming candle may update as prices change. Historical results may also differ between brokers due to differences in candle data and available history.


Trend Swing Radar is a visual analysis tool and does not provide financial advice or guarantee future price direction or trading profitability.

Summary

Indicator profile
Indicator category
Trend
Output type
Visualisation
Data requirements
Bars only

Discussion

Customer reviews

0.0
Reviews: 0
Customer reviews
No reviews for this product yet. Already tried it? Be the first to tell others!

FAQ

Key Levels
Market Structure
Support & Resistance
Products available through cTrader Store, including trading bots, indicators and plugins, are provided by third-party developers and made available for informational and technical access purposes only. cTrader Store is not a broker and does not provide investment advice, personal recommendations or any guarantee of future performance.

You may also like

Indicator
Prop
Institution-level trend Analyzer.
Indicator
AI
ATR
+27
Market Cipher B
Indicator
Volume
Order Block
+3
Map market structure, order blocks, liquidity and key zones with an interactive cTrader dashboard.
Indicator
ATR
RSI
+5
🚀 HAI QUANTUM v4.0 | The Ultimate Quantum Terminal for cTrader (Smart Money & Algorithmic Trading)
Indicator
Key Levels
Liquidity Grab
+2
The levels you mark each morning, drawn and followed: PDH/PDL, weekly, monthly, sessions, equal highs/lows.
Indicator
Imbalance
Fair Value Gap
+4
Fair Value Gap scanner with live fill telemetry, 50% CE lines, 4 mitigation rules, and a 3-stage native alert system.
Indicator
EMA
Forex
+5
ALMA Smoothed Gaussian Moving Average (ASGMA) – by LudwigICT
Indicator
ATR
EMA
+2
Dense EMA rainbow + Pro tools & a tested engine — get more from your EMAs, your research base for EMA bots.
Indicator
SMC
Forex
+5
Detect institutional breakout zones with smart volume & channel analysis — by PrimeQuant.
Indicator
VWAP
Volume
+5
The MA Quant Volume Profile Custom Range is a trading indicator that analyzes volume distribution across the price.
Indicator
AI
Forex
+10
Woodie_CCI_pro is an advanced CCI-based toolkit built around the classic Woodie CCI methodology.
Indicator
BOS
EMA
+5
VWAP Bands indicator with 3 standard deviation levels, buy/sell zones, and a draggable ON/OFF button to toggle the entir
Indicator
AI
ATR
+10
FX Sniper: Multi-pair Forex analysis tool. Features trend logic, adaptive pivots, and momentum filtering for major pairs
Indicator
ATR
RSI
+5
Multi-timeframe trend indicator using EMA, MACD & ADX to confirm high-probability buy and sell bias.
Indicator
Forex
EURUSD
+3
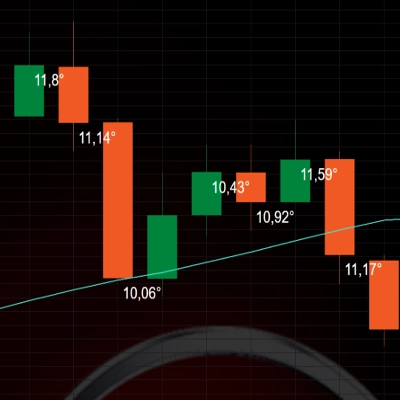
ATR-normalized MA slope in degrees, comparable across all instruments. Color-coded labels flag strong trend moves.
Indicator
BOS
Volume
+5
The Volume Delta Indicator using Institutional Level 2 DOM Data, The Edge Institutions Pay Millions For, now on cTrader
Indicator
AI
Prop
+16
Pro trading dashboard: WVAP analysis + Volume Profile + Neural AI tracking + News alerts. All-in-one tool!
Indicator
Fair Value Gap
Liquidity Grab
+2
PRO Liquidity Sweep + FVG Combo detector with custom Gold/Blue signals & alerts

Price

Since 08/07/2026