present
Sign up and get $50 off your first purchase
Trading product for CQL Trend Strength Index Indicator Premium/Discount  Supertrend, image 1
CQL Trend Strength Index
Indicator
52 downloads
Version 1.1, Aug 2026
Windows, Mac
Trading product for CQL Trend Strength Index Indicator Premium/Discount  Supertrend, image 2
Trading product for CQL Trend Strength Index Indicator Premium/Discount  Supertrend, image 3
Trading product for CQL Trend Strength Index Indicator Premium/Discount  Supertrend, image 4
Trading product for CQL Trend Strength Index Indicator Premium/Discount  Supertrend, image 5
36.24K
Traded volume
336
Pips won
2
Sales
52
Free installs

Description

What it analyses

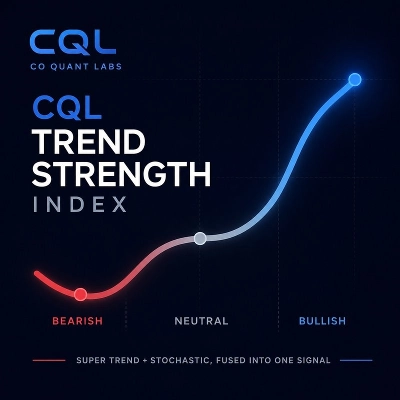
CQL Trend Strength Index combines Supertrend and Stochastic into a single unified signal instead of running them as two separate tools on your chart. It reads price direction alongside momentum and classifies current market conditions into one of three states: Strong Buy, Strong Sell, or Ranging.

How to interpret the signal

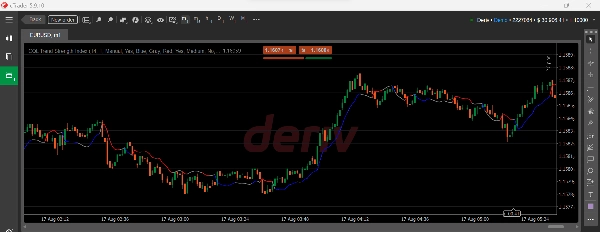
The indicator plots a single smoothed line directly on price. Its color tells you everything at a glance:

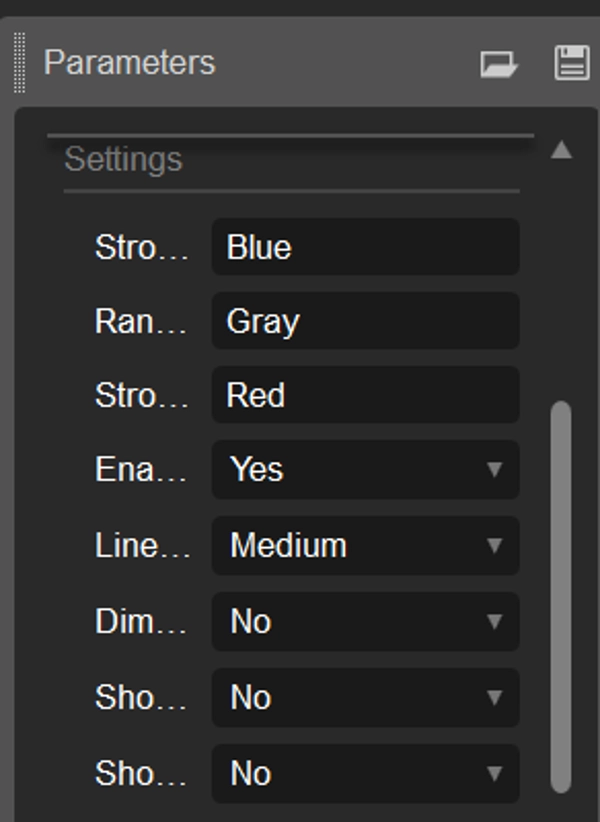
  • Blue means Strong Buy. Price and momentum are both confirming bullish strength.
  • Red means Strong Sell. Price and momentum are both confirming bearish strength.
  • Gray means Ranging. Momentum is sitting in a neutral zone, signaling low conviction regardless of price direction.

This is a trend context tool, not an entry signal generator. It tells you the character of the current market so you can apply your own entry method with better awareness of whether you're trading with a strong trend or into a ranging chop.

Key settings and parameters

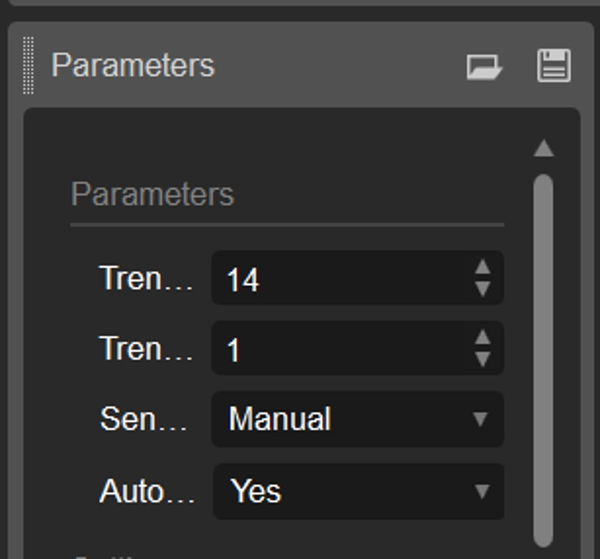
  • Trend Period and Trend Reactivity give you full control over how fast or slow the indicator responds
  • Sensitivity Preset (Slow, Medium, Fast, Manual) lets you tune it quickly without touching raw numbers
  • Auto Adapt to Timeframe adjusts sensitivity automatically based on your chart
  • Settings tab covers full color customization, line thickness, state labels, background zone tinting, and a reset to default option

Typical use cases

  • Quickly confirm whether a market is trending strongly before looking for entries with another tool or method
  • Filter out ranging or choppy conditions where trend following strategies typically underperform
  • Get a fast visual read of trend health without interpreting two separate indicators

Who it's for

Traders who already have an entry method, manual or automated, and want a fast, reliable trend context filter layered on top. Suitable for discretionary swing traders as well as those building rule based systems who need a clean trend versus no trend classification.

Limitations and usage notes

  • This is a trend context indicator, not a buy or sell entry signal. It does not predict reversals or generate trade entries
  • Like all trend following tools, it will lag at the start of a new trend and can stay in Ranging during low momentum breakouts
  • Best used alongside your own risk management and entry confirmation, not as a standalone trading system

Summary

AI summary
The CQL Trend Strength Index is a technical indicator that combines Supertrend and Stochastic signals into a single, smoothed line plotted directly on the price chart. It classifies market conditions into three states: Strong Buy (blue), Strong Sell (red), or Ranging (gray), reflecting the combined analysis of price direction and momentum. This indicator serves as a trend context tool, helping traders quickly assess whether the market is trending strongly or moving sideways, rather than generating specific trade entry signals.

Key features include adjustable Trend Period and Reactivity settings, sensitivity presets (Slow, Medium, Fast, Manual), and automatic adaptation to the chart’s timeframe. Users can customize colors, line thickness, labels, and background zone tinting. Typical use cases involve confirming strong trends before applying entry methods, filtering out ranging conditions where trend-following strategies may underperform, and obtaining a clear visual read of trend health without managing multiple indicators.

Designed for traders with existing entry strategies, it supports discretionary and rule-based trading by providing a reliable trend versus no-trend classification. The indicator requires integration with personal risk management and entry confirmation techniques and is intended for use across various markets where price bars are available.
Indicator profile
Indicator category
Trend
Output type
Visualisation
Data requirements
Bars only
Supported signals
Trend strength

Customer reviews

0.0
Reviews: 0
Customer reviews
No reviews for this product yet. Already tried it? Be the first to tell others!

Discussion

FAQ

Premium/Discount
Supertrend
MSS
Stochastic
Products available through cTrader Store, including trading bots, indicators and plugins, are provided by third-party developers and made available for informational and technical access purposes only. cTrader Store is not a broker and does not provide investment advice, personal recommendations or any guarantee of future performance.

More from this author

cBot
Forex
Crypto
+4
Stay on the right side of every major move on the Volatility 75 Index, automatically. No charts, no decisions.
7.6%
ROI
2.6
Profit factor

You may also like

Indicator
BOS
CHOCH
+5
BOS/CHoCH signals confirmed by liquidity sweep + FVG confluence, with a live conviction score.
Indicator
Fair Value Gap
The Pressure Gap indicator identifies sudden price jumps without using volume.
Indicator
ATR
RSI
+5
Binary Options Signals Pro – Precision Trading at Your Fingertips
Indicator
Signal
Supertrend
Multi-symbol multi-timeframe SuperTrend panel with watchlist, one-click jump, and alerts.
Indicator
Forex
GBPUSD
+5
Visual warning zones for high-impact news so you can manage risk before volatility hits.
Indicator
Volume
Channel
+2
Identify key support and resistance levels through detailed volume distribution analysis.
Indicator
VWAP
Volume
+4
Volume Profile + VWAP with Standard Deviations
Indicator
Volume
Channel
+3
A higher-timeframe log-regression channel with a volume profile, Point of Control and session levels.
Indicator
ATR
RSI
+7
Identify bullish and bearish Order Blocks to spot key support/resistance levels and potential trend reversals! 📈🔄
Indicator
Prop
Forex
+15
The best filter for trading trend continuations on Renko charts.
Indicator
Highlights market sessions & overlaps with real-time range & volume stats – perfect for pro scalpers.
Indicator
AI
SMC
+11
Perfect Entry Price designed to help traders identify the most accurate and reliable price levels for market entries
Indicator
One‑click RSI robot for consistent rapid‑fire trades.
Indicator
Volume
Liquidity Sweep
+1
Liquidity Profiler Tools
Indicator
Indicator calculates spread in pips
Indicator
BOS
MSS
+5
One indicator, full ICT/SMC picture — structure, OBs, FVGs, liquidity, Premium/Discount — with graded PRIME/SETUP signal
Indicator
Volume
Key Levels
+2
Support and resistance from a rolling volume profile, ranked by strength or recency, updated live.
Indicator
AI
ATR
+27
Supertrend Indicator

Price

36.24K
Traded volume
336
Pips won
2
Sales
52
Free installs