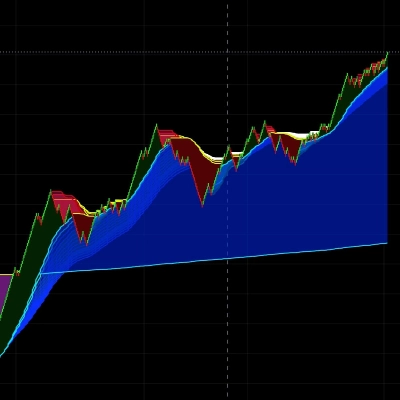
present
Sign up and get $50 off your first purchase
Since 13/02/2025

Description

Summary

AI summary
Sample EMA is an indicator for the cTrader (cAlgo) platform that combines the SuperTrend and Moving Average (MA) concepts into a single tool called SuperTrendMA. It calculates a user-selectable type of moving average (default is Exponential) over a specified period (MA Length). It also computes the Average True Range (ATR) over a defined ATR Period and applies an ATR Multiplier to generate SuperTrend bands. Market trends are identified based on price position relative to these bands: an uptrend is signaled when the price closes above the DownTrend Band, and a downtrend when it closes below the UpTrend Band. The indicator visually represents trends with colored lines—lime for uptrend and red for downtrend—and provides trade entry signals using arrows: green arrows indicate a shift from downtrend to uptrend (buy signal), and red arrows indicate a shift from uptrend to downtrend (sell signal). This indicator supports trend analysis and trade signal generation by integrating volatility and moving average data.
Indicator profile

Discussion

Customer reviews

0.0
Reviews: 0
Customer reviews
No reviews for this product yet. Already tried it? Be the first to tell others!

FAQ

Supertrend
ATR
Products available through cTrader Store, including trading bots, indicators and plugins, are provided by third-party developers and made available for informational and technical access purposes only. cTrader Store is not a broker and does not provide investment advice, personal recommendations or any guarantee of future performance.
You may also like

Indicator
Grid
Prop
+5
Logarithmic Framework by LudwigICT
Indicator
This indicator is a valuable tool for traders looking to identify significant opening price level of any asset.
Indicator
Prop
Forex
+2
⚔️ JPY Samurai Breakout Pro — Professional Breakout Indicator for cTrader ⚔️
Indicator
ATR
Upgrade to ATR-RMA! Experience the precise ATR using Relative Moving Average for accurate volatility analysis in cTrader
Indicator
Fibonacci
Key Levels
+1
Swing point and Fibonacci levels.
Indicator
ATR
BOS
+3
Marks swings, BOS/CHoCH breaks and open gaps with a plain-words panel. No signals. No promise of profit.
Indicator
📊 Smart Floating Risk Pro – Advanced Risk Management for cTrader
Indicator
Key Levels
Order Block
+3
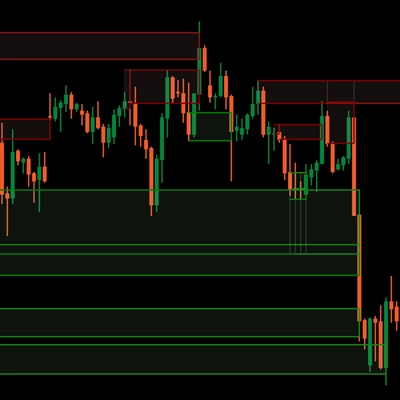
Professional indicator for automated detection and dynamic tracking of Supply & Demand zones in cTrader.
Indicator
SMC
VWAP
+4
Killzone Session and key levels with VWAP – Precision Meets Price Action
Indicator
ATR
Volume
+3
Volume profile key levels - POC, value area, volume peaks and troughs - with break, rejection and retest signals
Indicator
Master RSI reversals with Parabolic SAR precision! Get real-time alerts for high-probability trend changes.
Indicator
AI
Grid
+17
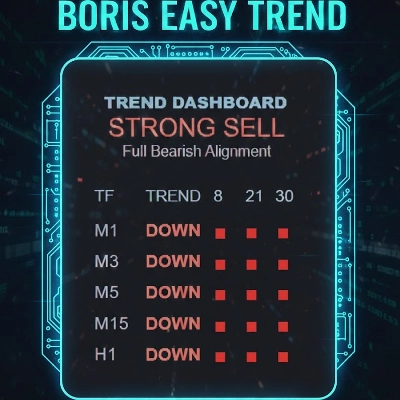
BORIS Easy Trend: Relax & scalp with 6-TF alignment. Clear BUY/SELL signals & movable UI/HUD make trading effortless.
Indicator
Parabolic SAR Alert - Trend reversal alerts with smart signals & custom alerts.
Indicator
RSI
VWAP
+5
📈 Anchored VWAP with auto High/Low, session resets, Daily VWAP & TWAP — precise, Pine-accurate port.
Indicator
ATR
Market Structure
+3
Support Resistance Toolkit
Indicator
Key Levels
Support & Resistance
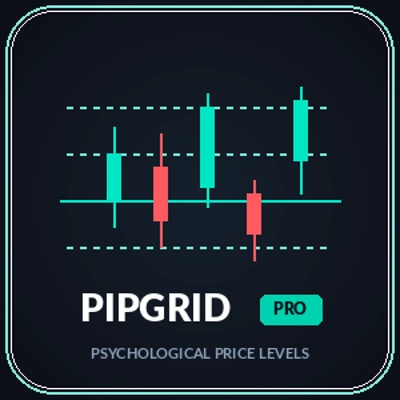
Clean psychological round-number grid with native pip and point auto-scaling across Forex, Gold, Indices, and Crypto.
Indicator
Prop
Forex
+13
⚔️Full breakout trading workstation: session box, EP/TP/SL levels, on-chart ✓/✗ outcomes, pro-level analytics and more⚔️
Indicator
RSI
SMC
+4
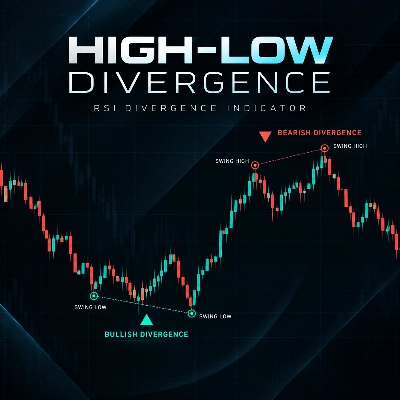
High Low Divergence is a clean, overlay indicator that automatically identifies swing highs and swing lows

Price

Since 13/02/2025