Description
Indicator Overview
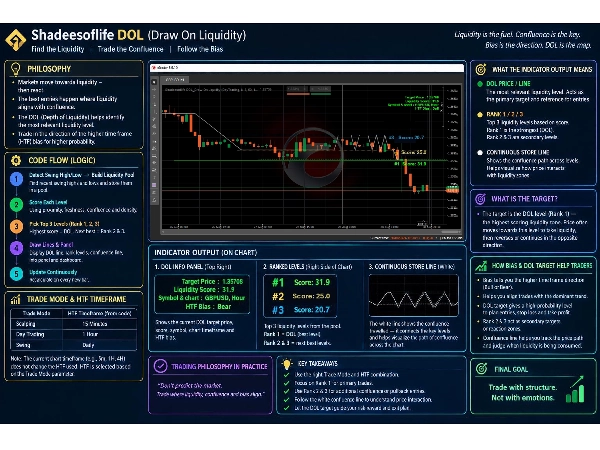
The Shadeesoflife DOL (Draw on Liquidity) c Trader indicator gives a dynamic target-identification engine based on Smart Money Concepts (SMC) and ICT principles. It automatically draws a Line on Liquidity (DOL), ranks, and tracks structural liquidity pools-"High confluence" across the market at every tick. DOL is a dynamic target, high confluence liquidity.
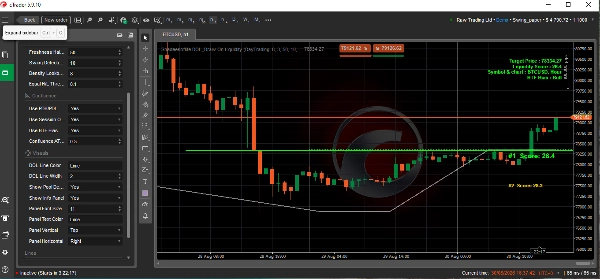
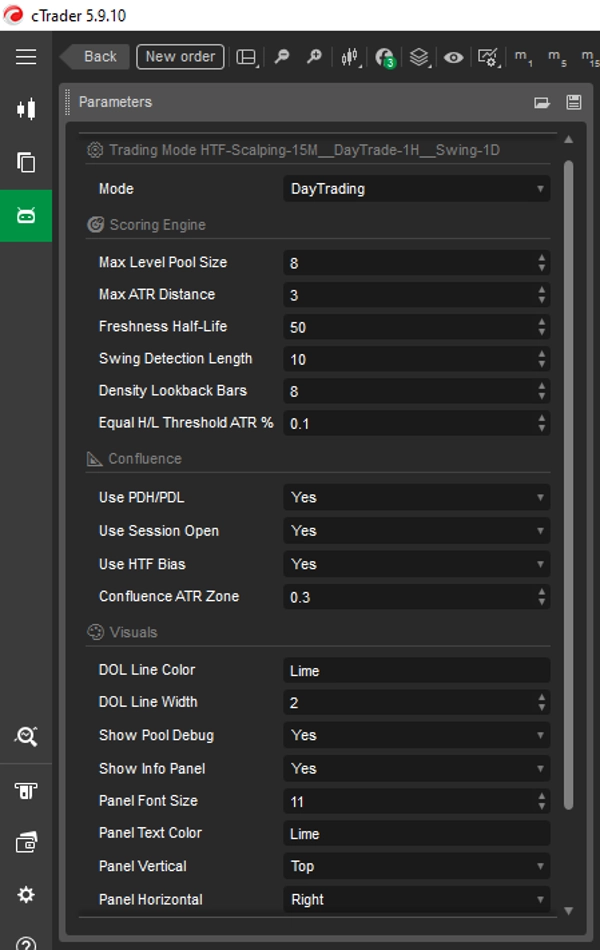
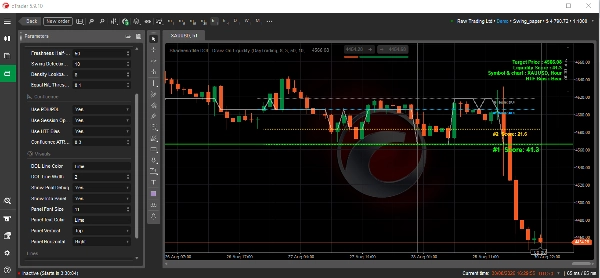
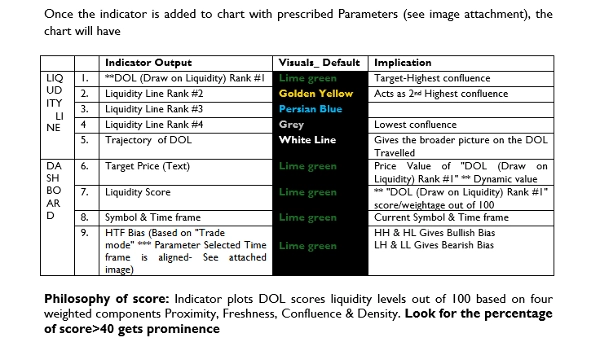
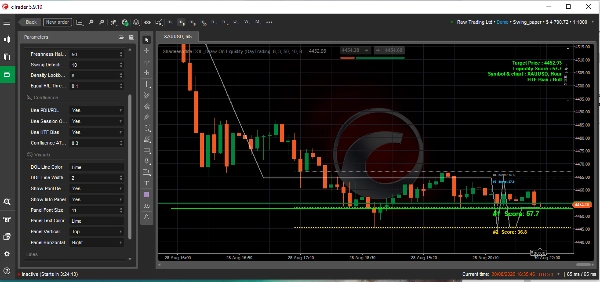
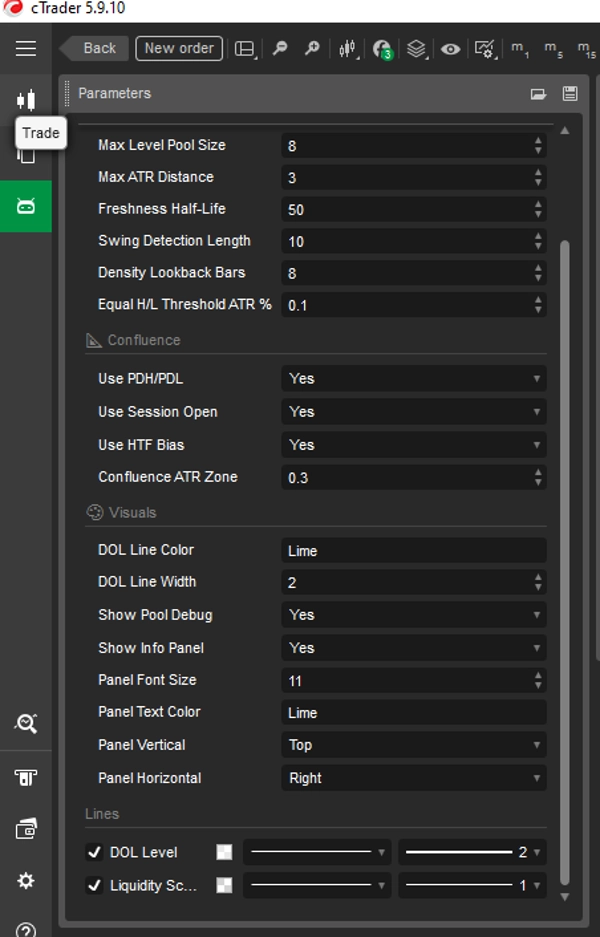
The indicator outputs a primary DOL Target (highest-scored level, shown as a prominent line) alongside an ranked pool of secondary liquidity targets, while providing an on-screen panel showing current HTF bias and target metrics. Once the indicator is added to chart with prescribed Parameters(see image attachment), the chart will have
For Answer- Refer image attached (Table).
Philosophy of score: Indicator plots DOL scores liquidity levels out of 100 based on four weighted components Proximity, Freshness, Confluence & Density.
FAQs
1.How it works-HTF & LTF Multi-Timeframe Strategy Framework??
Identifying Higher Timeframe (HTF) Bias and Direction
The indicator determines structural bias using the underlying Trading Mode selection to reference a higher timeframe (e.g., ***Daily for Swing, 1-Hour for Day Trading, 15-Minute for Scalping):
- Bullish HTF Bias:
- Condition: The HTF candle closes higher than its open (HTF Bullish).
- Indicator Behavior: The scoring engine shows Target price (#1 score tagged line) is marked below the Ask/bid price (HTF target shows internal liquidity and LTF target price shows external liquidity).
- Trading Implication: Price is seeking sell-side liquidity (SSL) below for a discount retracement before continuing upward, or targeting buy-side liquidity (BSL) above as the ultimate expansion target.
- Bearish HTF Bias:
- Condition: The HTF candle closes lower than its open (HTF Bear).
- Indicator Behavior: The scoring engine shows Target price (#1 score tagged line) is marked above the Ask/bid price (HTF target shows internal liquidity and LTF target price shows external liquidity).
- Trading Implication: Price is seeking buy-side liquidity (BSL) above for a premium retracement before moving downward, or targeting sell-side liquidity (SSL) below.
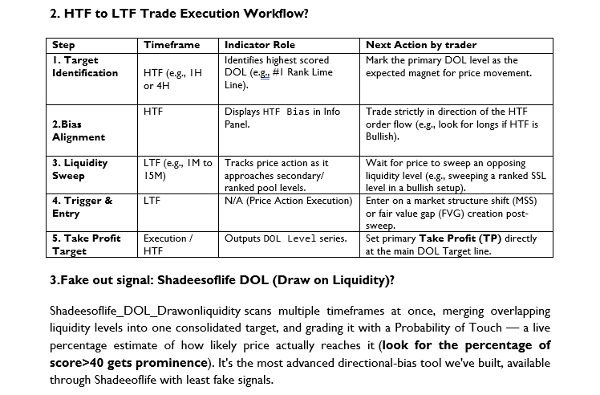
2. HTF to LTF Trade Execution Workflow?
For Answer- Refer image attached (Table).
3.Fake out signal: Shadeesoflife DOL (Draw on Liquidity)?
"Shadeesoflife DOL Draw on liquidity" scans multiple timeframes at once, merging overlapping liquidity levels into one consolidated target, and grading it with a Probability of Touch — a live percentage estimate of how likely price actually reaches it (look for the percentage of score>40 gets prominence). It's the most advanced directional-bias tool we've built, available through Shadeeoflife with least fake signals.
4. How Confluence in "Shadeesoflife DOL Draw on liquidity" technical works ?
"Shadeesoflife DOL Draw on liquidity" scans Internal liquidity, External liquidity, Order Blocks, Breaker Blocks, FVGs, iFVGs, and BSL/SSL for its directional bias. DOL Pro runs on a completely different engine — it scans EQH/EQL, large FVGs, session boundaries, PDH/PDL, and overnight/weekend gaps across multiple timeframes, reads session bias like Judas swings and continuations, and grades its target with a live Probability of Touch, with much smarter algorithms. Same directional-bias mission as DOL, built on a more rigorous engine. Gives the outcome of high probability setup by providing Direction and Higher Confluence target price.
Reads multiple timeframes at once, not just one, Scans EQH/EQL, large FVGs, session boundaries, PDH/PDL, and overnight/weekend gaps. Reads session bias — patterns like Judas swings and continuations.
┌──────────────────────────────────────┐
│ ICT / LIQUIDITY CONCEPTS │
│ DOL • PDH • PDL • Session • HTF │
│ Liquidity • Equal High/Low │
└──────────────────┬───────────────────┘
↓
┌──────────────────────────────────────┐
│ SMC / STRUCTURE LAYER │
│ Swing High • Swing Low │
│ Liquidity Pools • HTF Direction │
└──────────────────┬───────────────────┘
↓
┌─────────────────────────────────────────┐
│ SHADEESOFLIFE QUANT ENGINE │
│ Proximity X% + Freshness Y% + Confluence Z% + Density A% │
│ │
│ → 0–100 Score → Rank #1/#2/#3 → Dynamic DOL │
└─────────────────────────────────────────┘
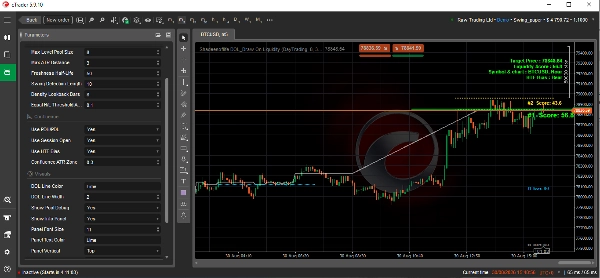
📊Technical Chart Breakdown( attached Image Interpretation)
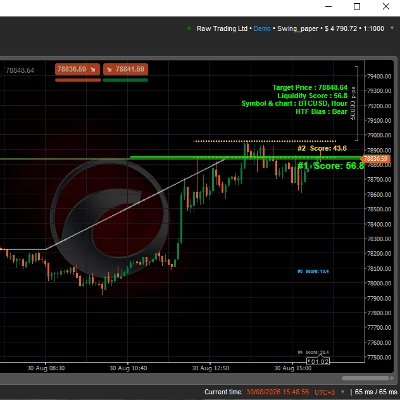
This chart from the cTrader Trading Platform displays BTCUSD (Bitcoin / US Dollar) on a 5-minute (m5) time horizon. It features a custom automated market structure indicator called "Shadeesoflife DOL Draw On Liquidity", which is configured using Smart Money Concepts (SMC).
🔎 Key Technical Metrics & Analysis
- Current Price: The asset is trading at 78,856.48, hovering tightly within a very narrow, high-liquidity range.
- Target Price / Draw on Liquidity (DOL): Marked by the solid bright green horizontal line at 78,848.64. This serves as a prominent magnet for price action.
- Liquidity Score (57.3): A moderate score indicating stable but not overwhelming resting institutional orders around this pocket.
- Higher Timeframe (HTF) Bias: Expressly labeled as Bearish (Bear). The system is looking for a continuation downward once resting buy liquidity is cleared.
- Algorithmic Priority Scores:
- #1 Score (57.3): Located right at the green target line.
- #2 Score (45.8): Resting slightly higher up at the red baseline level.
💡 Core Strategic Interpretation
The indicator is mapping out a classic SMC setup where the market engine seeks to sweep specific institutional pools.
- The Magnet Effect: The price has pushed upward into a premium zone and is now gravitating heavily toward the green Draw on Liquidity (DOL) baseline at 78,848.64.
- Trend Alignment: Because the structural HTF Bias is Bearish, this local downward pull toward the DOL line aligns perfectly with the dominant trend.
- Liquidity Clearance: Once price targets and mitigates the resting liquidity at this green line, traders typically watch for a decisive structural break or an aggressive continuation of the macro bearish direction.
Note:
- Can be used in BTCUSD, XAUUSD, GBPUSD or any symbol.
- Above BTCUSD analysis is based on chart LTF 5m (manual selection of chart) and HTF 1DAY (Parameter “Trade Mode” to Day trade from Drop down selection).
- The indicator can be used for(“Trade Mode” parameter selection aligns to time frame for BIAS*)
- Scalping- HTF 15M, (Default)
- Day trade- HTF 1H,
- Swing trade- HTF 1D,
- Four Hour Trade- HTF 4H
- "Show pool debug" parameter can be used to switch off the less important Target confluence line except ranked #1.
- "Show info panel" parameter can be used to switch off to hide the panel.
- "Panel" can be customized with taxt size, text color & panel position(horizontal/ Vertical Position).
- "DOL level" line position in X axis co-ordinate(Price) indicates the Ranked #1 Target confluence line at respective Y axis co-ordinate(Time).
Summary
The indicator outputs a primary Draw on Liquidity (DOL) target line representing the highest-scored liquidity level, along with secondary ranked targets. It provides an on-screen panel displaying higher timeframe (HTF) bias and target metrics, supporting trading styles from scalping to swing trading by referencing appropriate HTFs (e.g., 15-minute for scalping, daily for swing).
Shadeesoflife DOL integrates multi-timeframe analysis, scanning equal highs/lows, fair value gaps, session boundaries, previous day highs/lows, and gaps to assess directional bias and price magnet levels. It calculates a live Probability of Touch (PoT) percentage estimating the likelihood of price reaching each target.
Traders use the indicator to align trades with HTF bias, identify liquidity sweeps on lower timeframes, and set entries and take profit targets at ranked liquidity pools. It supports markets including BTCUSD and XAUUSD and offers customizable display options for target lines and info panels.