
Descrição
📌 Tendência do Filtro de Kalman – Visão Geral & Revisão
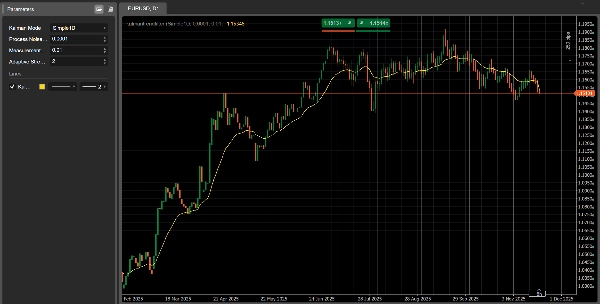
Tendência do Filtro de Kalman é um indicador avançado de seguimento de tendência para cTrader, projetado para fornecer uma linha de tendência suave e altamente responsiva com atraso significativamente menor do que as médias móveis tradicionais.
Onde os filtros clássicos SMA/EMA reagem lentamente e frequentemente perdem mudanças iniciais de tendência, o Filtro de Kalman:
- Atualiza continuamente sua estimativa do preço “real”
- Equilibra suavidade e responsividade matematicamente
- Adapta-se à volatilidade (modo Adaptativo)
- Modela tanto preço quanto velocidade (modo 2D)
Isso o torna uma ferramenta poderosa tanto para traders manuais quanto para desenvolvedores de sistemas automatizados.
🎛 Modos & Parâmetros
Modo Kalman (3 Versões em Um Indicador)
1️⃣ Simple1D
Um filtro Kalman clássico 1D.
Rápido, limpo e excelente para detecção de tendência de curto prazo.
2️⃣ PositionVelocity2D
Modela tanto o preço quanto a velocidade da tendência.
Ideal como um filtro direcional em estratégias algorítmicas.
3️⃣ Adaptive1D
Ajusta-se automaticamente à volatilidade.
Mais reativo em mercados rápidos, mais suave em condições calmas.
🧩 Parâmetros-Chave Explicados
- Ruído do Processo (Q):
Maior = reação mais rápida à tendência, menor = linha mais suave. - Ruído da Medição (R):
Maior = filtro confia menos nos dados → resultado mais suave. - Força Adaptativa:
Usado apenas no Adaptive1D. Controla o quanto a volatilidade afeta o filtro.
📈 Como Interpretar Sinais
1. Detectando a Direção da Tendência
- Tendência de Alta: Linha inclinada para cima, preço mantendo-se acima do filtro.
- Tendência de Baixa: Linha inclinada para baixo, preço mantendo-se abaixo do filtro.
- Lateral: Mercado está em consolidação, evite estratégias de rompimento.
2. Sinais de Entrada (Lógica de Cruzamento)
Entrada de Alta:
- Preço fecha acima da linha de Kalman
- A linha começa a se inclinar para cima
Entrada de Baixa:
- Preço fecha abaixo da linha de Kalman
- A linha começa a se inclinar para baixo
3. Força da Tendência (Modo 2D)
A inclinação torna-se uma leitura direta do momentum:
- Inclinação forte para cima → tendência de alta forte
- Inclinação forte para baixo → tendência de baixa forte
- Inclinação achatando → enfraquecimento da tendência ou fase de transição
📊 Exemplos Práticos de Uso
✔ Estratégia de Seguimento de Tendência
Use Simple1D ou Adaptive1D:
- Compre acima da linha quando a inclinação se tornar positiva
- Venda abaixo da linha quando a inclinação se tornar negativa
✔ Abordagem Multi-Temporal
- Use Kalman no H1 para direção
- Use Kalman no M15 para entradas precisas
- Entre apenas na direção indicada pelo timeframe maior
✔ Integração com Bots
Perfeito para trading algorítmico:
- Permitir apenas posições longas se inclinação > 0
- Permitir apenas posições curtas se inclinação < 0
- Use Adaptive1D para índices voláteis como US500, NAS100, US2000
🌟 Junte-se à Nossa Comunidade
Se você quer acesso a:
- Otimizações exclusivas para cada um dos nossos bots
- Dicas avançadas de configuração
- Melhorias no trading
- Ajuda técnica personalizada
- Atualizações e novas ferramentas
👉 Junte-se à nossa comunidade clicando no link na minha página de perfil.
Lá você encontrará as melhores configurações de otimização para todos os nossos bots, atualizadas regularmente.
Resumo
Avaliações de clientes
5 | 0 % | |
4 | 100 % | |
3 | 0 % | |
2 | 0 % | |
1 | 0 % |


![Logótipo de "[Stellar Strategies] Market Session Ultimate"](https://cdn.ctrader.com/image/webp/61ffd537-0125-4246-9e72-42eca1791d64_28232)


