Descrição
TrendFallowing: é um indicador técnico avançado para a plataforma cTrader que combina múltiplas abordagens analíticas em uma única solução. Desenvolvido para traders que buscam confirmação de tendência através da convergência de indicadores, oferece uma visão completa do mercado com sinais precisos e filtros de validação.
ASSISTA AO VÍDEO INTRODUTÓRIO SOBRE A ESTRATÉGIA OPERACIONAL!
🎯 ESTRATÉGIAS DE USO
1. Negociação de Acompanhamento de Tendência
Aplicação: Identificar e seguir tendências estabelecidas
Período: H4, D1 para posições mais longas
Configurações: ADX > 25, Volume acima da média
Gestão de Risco: Stop-loss abaixo da média móvel de 50 períodos
2. Swing Trading
Aplicação: Capturar movimentos de médio prazo
Período: H1, H4
Configurações: Filtro de volume ativado, confirmação pelo Perfil de Volume
Alvos: POC do Perfil de Volume como TP
3. Negociação de Breakout
Aplicação: Entrar em rompimentos de suporte/resistência
Configurações: Volume PVA para confirmar a força do movimento
Confirmação: ADX em alta + Volume acima da média
4. Scalping (Períodos Mais Curtos)
Aplicação: Negociações rápidas com múltiplas confirmações
Período: M1, M5
Configurações: Filtros de volume rigorosos e Momentum
🔧 COMO FUNCIONAM OS INDICADORES
NÚCLEO ADX & DI
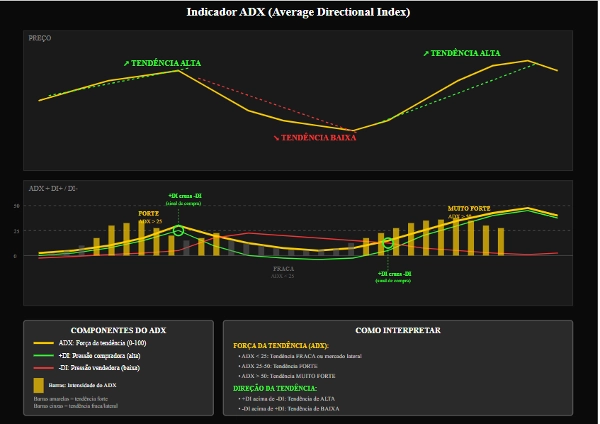
ADX (Índice Direcional Médio)
Função: Medir a força da tendência
Interpretação:
0-25: Tendência fraca/movimento lateral
25-50: Tendência forte
50+: Tendência muito forte
Uso Prático: Evitar negociações quando ADX < 20
+DI / -DI (Indicadores Direcionais)
+DI: Força dos compradores
-DI: Força dos vendedores
Sinal: Cruzamento do +DI acima do -DI (compra) e vice-versa
Inclinação do ADX (ADX Slope)
Função: Medir a aceleração da tendência
Gráfico: Histograma ciano
Sinal: Valores positivos indicam fortalecimento da tendência
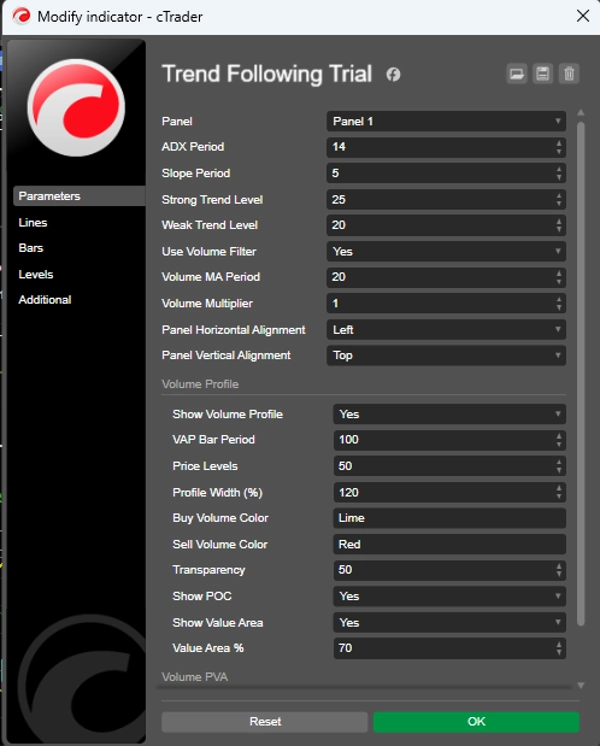
FILTROS DE VOLUME
Filtro MA de Volume
Função: Validar sinais com volume acima da média
Parâmetros: Período 20, Multiplicador 1.0
Uso: Confirmação do interesse institucional
Volume PVA (Análise de Volume de Preço)
Cores e Significado:
Verde: Compra com volume muito alto (>150% da média)
Azul: Compra com volume alto
Vermelho: Venda com volume muito alto
Rosa: Venda com volume alto
Amarelo: Pin Bar/Esgotamento com rompimento de suporte
PERFIL DE VOLUME
POC (Ponto de Controle)
Função: Preço com maior volume negociado
Uso: Alvo natural para negociações, suporte/resistência dinâmicos
Área de Valor
Função: Zona onde 70% do volume foi negociado
Interpretação:
Preço acima: Tendência de alta
Preço abaixo: Tendência de baixa
Dentro: Possível movimento lateral
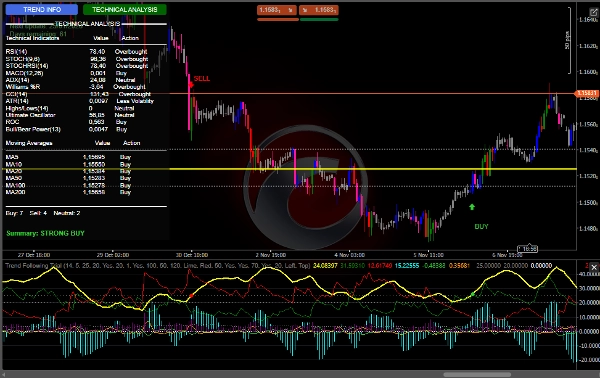
Painel de Indicadores
RSI: Sobrevendido (<30) / Sobrecomprado (>70)
MACD: Momentum
Williams %R: Condições Extremas
CCI: Identificação de Reversão
Estocástico: Momentum de curto prazo
Oscilador Ultimate: Momentum multi-temporal
Médias Móveis
Conjunto completo de MAs (5, 10, 20, 50, 100, 200)
Análise de alinhamento para tendências
⚙️ CONFIGURAÇÕES RECOMENDADAS
Configuração Conservadora
Período ADX: 14
Período da Inclinação: 5
Nível de Tendência Forte: 25
Nível de Tendência Fraca: 20
Usar Filtro de Volume: true
Período MA de Volume: 20
Multiplicador de Volume: 1.2
Configuração Agressiva
Período ADX: 10
Período da Inclinação: 3
Nível de Tendência Forte: 20
Nível de Tendência Fraca: 15
Usar Filtro de Volume: true
Período MA de Volume: 14
Multiplicador de Volume: 1.0
Perfil de Volume (Recomendado)
Mostrar Perfil de Volume: true
Período da Barra VAP: 100
Níveis de Preço: 50
% da Área de Valor: 70
Mostrar POC: true
🎨 RECURSOS VISUAIS
Interface do Usuário
Painel Dinâmico: Informações em tempo real
Botões Interativos: Alternar entre análises
Cores Intuitivas: Codificação baseada em função
Sinais Gráficos
Setas: entradas COMPRA/VENDA
Sons: alertas audíveis
Cores das Barras: análise PVA integrada