Description
Identifier les zones d'INTÉRÊT INSTITUTIONNEL ÉLEVÉ : Là où il y a PLUS DE VOLUME dans les cassures, il y a UNE PARTICIPATION PLUS IMPORTANTE des GRANDS ACTEURS.
• ⚖️ Mesurer l'ÉQUILIBRE DES FORCES : Voir si LA PRESSION D'ACHAT ou DE VENTE domine dans chaque zone de prix
• 🎯 Détecter les NIVEAUX CLÉS : Zones avec UN VOLUME DE CASSURE PLUS ÉLEVÉ agissent souvent comme SUPPORT/RÉSISTANCE FUTURS
• ✅ Confirmer les mouvements : Une CASSURE avec UN VOLUME ÉLEVÉ a une PROBABILITÉ PLUS ÉLEVÉE d'être authentique
https://chartshots.spotware.com/c/6941a3f65f376
📈 COMMENT LE LIRE ?
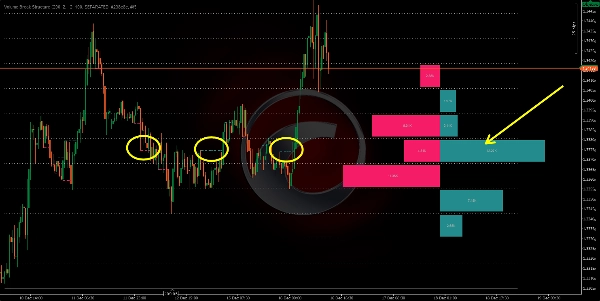
📊 Les lignes horizontales
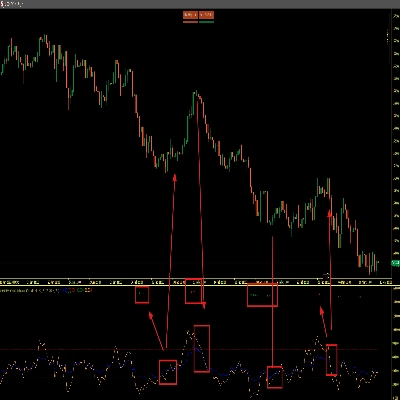
• Chaque ligne marque un niveau où une CASSURE DE STRUCTURE s'est produite
• 🟢 Cassures haussières
• 🔴 Cassures baissières
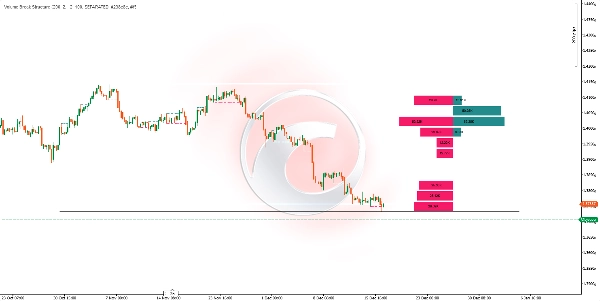
📈 L'histogramme
• Situé sur le CÔTÉ DROIT DU GRAPHIQUE
• Divisé en RANGÉES représentant des PLAGES DE PRIX ÉGALES
• 📗 Barres de PRESSION D'ACHAT : VOLUME ACCUMULÉ des cassures haussières dans cette zone
• 📕 Barres de PRESSION DE VENTE : VOLUME ACCUMULÉ des cassures baissières dans cette zone
• ⬆️ Taille de la barre : Une taille PLUS GRANDE indique un VOLUME PLUS IMPORTANT de cassures à ce niveau
https://chartshots.spotware.com/c/6941a4346ede0
🟦 La grille
• Les lignes PLEINES du haut et du bas marquent la PLAGE MAXIMALE et MINIMALE de la période analysée
• Les lignes POINTILLÉES divisent cette plage en SECTIONS ÉGALES pour une lecture facilitée
⚙️ 🔧 PARAMÈTRES PRINCIPAUX
Fonction du paramètre
🕯️ Barres de calcul
Nombre de chandeliers analysés EN ARRIÈRE
🎚️ Longueur du swing
SENSIBILITÉ pour détecter les pivots (PLUS ÉLEVÉE = moins de signaux, PLUS FIABLE)
📊 Rangées de l'histogramme
Nombre de DIVISIONS/RANGÉES dans l'histogramme
📏 Largeur de l'histogramme
LARGEUR VISUELLE de l'histogramme
👁️ Mode d'affichage
SÉPARÉ (achat/vente) ou AGRÉGÉ (volume total)
🔄 QUAND SE MET-IL À JOUR ?
🕒 L'indicateur SE RECALCULE AUTOMATIQUEMENT à la FERMETURE de chaque chandelier, intégrant toute NOUVELLE CASSURE DE STRUCTURE qui s'est produite.
💡 🤝 COMMENT LE COMBINER ?
📈 Avec l'ANALYSE DE TENDANCE
• Dans une TENDANCE HAUSSIÈRE, cherchez les zones où LE VOLUME DE PRESSION D'ACHAT DOMINE pour des entrées potentielles lors des RETRAITS
• Dans une TENDANCE BAISSIÈRE, cherchez les zones où LE VOLUME DE PRESSION DE VENTE DOMINE pour des entrées potentielles lors des REBONDISSEMENTS
🛡️ Avec le SUPPORT et la RÉSISTANCE
• Les niveaux avec le VOLUME DE CASSURE LE PLUS ÉLEVÉ deviennent souvent des ZONES DE RÉACTION FUTURES
• Utilisez l'histogramme pour identifier les zones les plus "DÉFENDUES" par les acheteurs ou les vendeurs
🌊 Avec le FLUX D'ORDRES
• CONFIRMER les lectures de l'histogramme avec des outils de FLUX D'ORDRES EN TEMPS RÉEL
• Les zones de volume de cassure élevé coïncident souvent avec des ZONES D'ABSORPTION INSTITUTIONNELLE
🕯️ Avec l'ACTION DES PRIX
• Cherchez des MODÈLES DE CHANDELIERS dans les zones où l'histogramme montre un DÉSÉQUILIBRE SIGNIFICATIF
• Un MODÈLE DE RENVERSEMENT dans une zone de FORTE PRESSION D'ACHAT a une PROBABILITÉ DE SUCCÈS PLUS ÉLEVÉE
🎯 🚀 INTERPRÉTATION RAPIDE
Signal visuelInterprétation
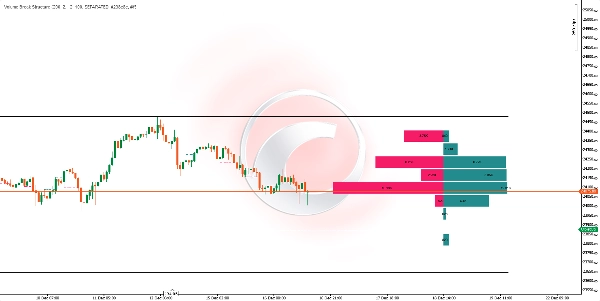
📗 Grande barre d'ACHETEUR, 📕 petite barre de vendeur
ZONE DE DEMANDE FORTE, support possible SUPPORT
📕 Grande barre de VENDEUR, 📗 petite barre d'acheteur
ZONE D'OFFRE FORTE, résistance possible RÉSISTANCE
⚔️ Les deux barres GRANDES et similaires
ZONE DE COMBAT, FORTE VOLATILITÉ attendue
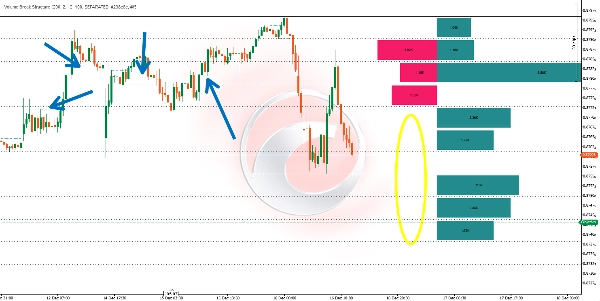
⏭️ Rangée sans BARRES
ZONE DE PEU D'INTÉRÊT, le prix est passé RAPIDEMENT
CONSIDÉRATIONS IMPORTANTES
• ❌ L'indicateur FONCTIONNE AVEC DES DONNÉES HISTORIQUES CONFIRMÉES ; IL NE PRÉDIT PAS L'AVENIR
• 📊 UN NOMBRE PLUS ÉLEVÉ de barres de calcul = UNE VUE PLUS LARGE mais peut DILUER LES SIGNES RÉCENTS
• ⏰ AJUSTEZ la longueur du swing selon l'ÉCHELLE DE TEMPS : VALEURS PLUS ÉLEVÉES pour des ÉCHELLES DE TEMPS PLUS GRANDES
• 🛡️ COMBINEZ TOUJOURS avec une GESTION APPROPRIÉE DU RISQUE
Résumé
Key features include:
- Horizontal lines marking bullish (green) and bearish (red) structure breaks.
- A histogram on the right side of the chart divided into rows representing equal price ranges, showing accumulated volume of bullish and bearish breaks. Larger bars indicate higher volume.
- A grid marking the maximum and minimum price range of the analyzed period, divided into equal sections for easier reading.
The indicator recalculates automatically at the close of each candle, updating with any new structure breaks. Main adjustable parameters include the number of bars analyzed backward, swing length sensitivity for pivot detection, histogram rows, histogram width, and display mode (separated buy/sell or aggregated volume).
Volume Break Structure can be combined with trend analysis, support and resistance levels, order flow tools, and price action patterns to confirm market movements and identify potential entry points. It works with confirmed historical data and does not predict future price action.
Avis clients
5 | 0 % | |
4 | 100 % | |
3 | 0 % | |
2 | 0 % | |
1 | 0 % |