Descrição
A maioria dos indicadores de tendência responde à mesma pergunta da mesma forma: suavizar o preço, traçar algumas linhas, procurar cruzamentos. O FDQ Price Channel foi construído em torno de uma pergunta diferente — o que o preço realmente está fazendo, livre de ruído e deriva, e o que isso lhe diz sobre para onde ele provavelmente vai?
O resultado é um indicador de tendência baseado em canal que combina três camadas analíticas distintas em uma única sobreposição legível.
- Pontos-chave
Um Ponto de Partida Diferente. A série de preços que a maioria dos indicadores usa é, estatisticamente, um problema.
Os preços brutos carregam um componente de passeio aleatório que obscurece a estrutura significativa. Antes de qualquer canal ser desenhado, o FDQ aplica uma transformação de diferenciação fracionária — uma técnica emprestada da pesquisa quantitativa — que remove essa deriva enquanto preserva deliberadamente a memória de longo alcance nos dados. O que resta é uma série transformada que ainda reflete onde o mercado esteve, mas que não é mais dominada por onde ele está atualmente. Esta é a base sobre a qual tudo o mais é construído.
- O Ruído Tem um Custo
Todo método de suavização baseado em atraso troca tempo por precisão. O filtro de Kalman não.
O filtro de Kalman é um processo de estimativa recursiva: ele atualiza continuamente sua visão do mercado, equilibrando o quanto confiar nos novos dados versus o que já foi estabelecido. Diferente de uma média móvel, ele não tem uma janela fixa de retrocesso e não trata todas as barras passadas igualmente. A saída é uma representação mais limpa do preço que responde rapidamente a movimentos genuínos e resiste a reagir ao ruído — sem os sinais atrasados que a suavização normalmente produz.
- Bandas Construídas a partir do Comportamento, Não da Fórmula
Bandas de desvio padrão assumem que o preço é normalmente distribuído. Raramente é.
Os limites do canal FDQ são definidos usando análise de quantis — a distribuição estatística real do preço transformado durante o período de retrocesso. A banda superior marca o nível que a série realmente alcança no extremo superior de seu intervalo; a banda inferior faz o mesmo no extremo inferior. Estes não são limites teóricos calculados a partir de uma média — eles refletem onde o preço realmente negociou, o que os torna mais responsivos a como o mercado está realmente se comportando em qualquer momento.
- Uma Segunda Camada Dentro do Canal
As bandas externas definem o alcance. As bandas internas definem a zona.
Um segundo conjunto de bandas fica proporcionalmente entre o canal externo e sua linha média. Esta camada interna cria uma zona de negociação distinta — mais estreita que o canal completo, ancorada na mesma base estatística — que serve como uma referência graduada para entradas e classificação de sinais.
- Estado da Tendência Antes de Tudo
Um sinal sem contexto é apenas dado aleatório.
O indicador acompanha continuamente o estado direcional do canal, usando um mecanismo de votação majoritária entre os três componentes da banda. Quando pelo menos dois dos três se movem na mesma direção, o estado da tendência é confirmado como Ascendente ou Descendente. Sinais são gerados apenas em alinhamento com o estado atual — configurações longas apenas em condições Ascendentes, configurações curtas apenas em condições Descendentes. Quando o mercado não atende a esse limiar, nenhum estado é declarado e nenhum sinal é gerado. As transições entre estados são marcadas como linhas verticais diretamente no gráfico.
- Três Configurações Distintas de Reversão
Nem todos os recuos são iguais. O indicador reconhece três gradações.
Uma vez que um estado de tendência está ativo, o indicador observa padrões específicos de reversão — momentos em que o preço se moveu contra a tendência, tocou um nível definido e reverteu passando por ele.
-
- Reversão Média — O preço cai abaixo (ou sobe acima) da linha média do canal e se recupera. Um recuo padrão dentro de uma tendência.
- Reversão Profunda — O preço se estende mais, alcançando o extremo da banda interna antes de se recuperar. Um recuo mais comprometido com uma reversão mais decisiva.
- Reversão Leve — O preço toca a banda interna do lado da tendência e volta rapidamente. A mais superficial das três, ocorrendo com maior frequência.
Cada tipo é visualmente distinto no gráfico e pode ser ativado ou desativado independentemente.
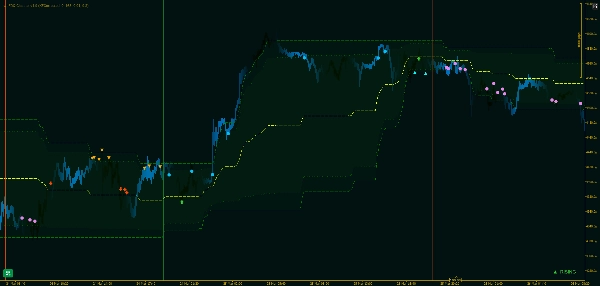
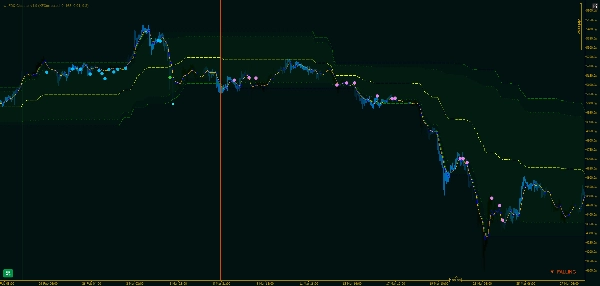
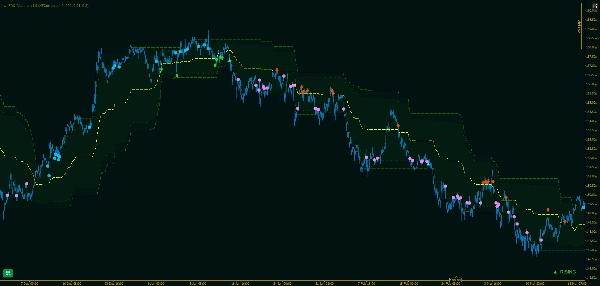
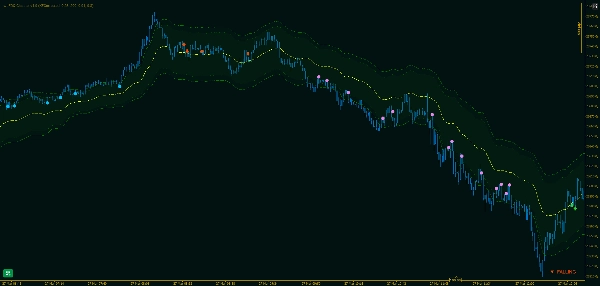
- O Que Você Vê
O gráfico conta a história diretamente, sem interpretação.
O canal principal, as bandas internas e a linha média sobrepõem o preço como linhas contínuas. As transições de regime são marcadas com linhas verticais — verdes para Ascendente, vermelhas para Descendente — para que o histórico das mudanças de estado da tendência seja visível de relance. Marcadores de sinal aparecem na barra onde cada reversão é confirmada, com ícones separados para cada tipo e direção de sinal.
- Por Que Esta Abordagem Funciona
A maioria dos indicadores de canal atrasa quando os mercados se movem rápido e reage em excesso quando não se movem.
Porque o canal FDQ é construído sobre uma transformação estacionária que preserva a memória em vez de uma média móvel, as bandas se ajustam à distribuição do comportamento real em vez de perseguir o preço. A camada de Kalman mantém a estimativa subjacente limpa sem introduzir o custo de tempo que vem com a suavização por janela. O resultado é um canal que permanece significativo em diferentes condições de mercado — tendência, lateral e transição — sem necessidade de ajuste manual.
Resumo
The channel boundaries are defined by quantile analysis of the transformed price distribution rather than standard deviation, capturing actual price extremes over the lookback period. It features outer bands marking the full range and inner bands creating a narrower trading zone for refined entry signals. The indicator continuously tracks trend direction using a majority vote across three band components, confirming Rising or Falling states and marking transitions with vertical lines on the chart.
Within active trends, wt.FDQ Channel identifies three distinct rebound setups—Light, Mid, and Deep—each representing different pullback intensities and reversal confirmations. These signals are visually distinct and configurable. The overlay displays the primary channel, inner bands, midline, trend states, and rebound signals directly on the price chart, supporting analysis across various markets including Forex, indices, and cryptocurrencies.
Avaliações de clientes
5 | 100 % | |
4 | 0 % | |
3 | 0 % | |
2 | 0 % | |
1 | 0 % |


