Penerangan
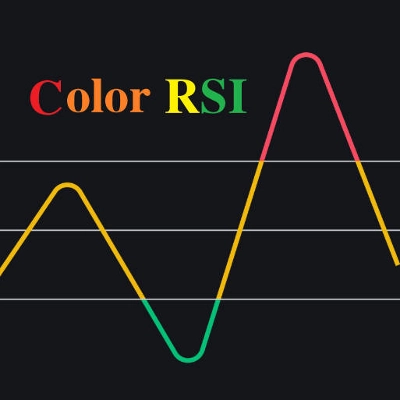
Ini adalah penunjuk super yang menggabungkan penunjuk RSI dengan sistem purata bergerak berganda. Intensiti RSI diwakili oleh empat warna: merah (>70) > oren (>50) > kuning (>30) > hijau. Purata bergerak berganda menggunakan EMA dengan parameter lalai ditetapkan pada 48/144, yang boleh disesuaikan mengikut keperluan anda.
Cara menggunakan:
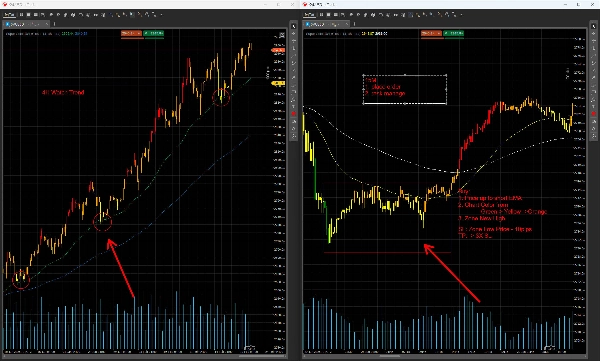
Apabila digunakan bersama dengan pelbagai rangka masa (contohnya, 4H→15M; 1H→5M, yang diilustrasikan di sini menggunakan 4H→15M sebagai contoh):
- Pengenalpastian trend melalui dual EMA (rangka masa 4H):
-
- Trend menaik: 48EMA di atas 144EMA.
- Trend menurun: 48EMA di bawah 144EMA.
- Konsolidasi julat terhad: Kedua-dua EMA bersimpang.
- Titik masuk/keluar pada rangka masa 15M:
-
- Persediaan beli (trend menaik):
-
- Harga retrace ke 48EMA pada carta 4H.
- Tukar ke 15M: Masuk apabila harga memecah di atas julatan konsolidasi 15M.
- Henti rugi: Tetapkan pada ayunan tinggi terkini +10 pips .
- Persediaan jual (trend menurun):
-
- Harga retrace ke 48EMA pada carta 4H.
- Tukar ke 15M: Masuk apabila harga memecah di bawah julatan konsolidasi 15M.
- Henti rugi: Tetapkan pada ayunan rendah terkini –10 pips .
- Isyarat perbezaan harga:
-
- Perbezaan menurun (atas):
-
- Harga membuat paras tinggi baru (pada pullback), tetapi warna RSI berubah dari merah (RSI >70) kepada oren (RSI >50) .
- Perbezaan menaik (bawah):
-
- Harga membuat paras rendah baru (pada pullback), tetapi warna RSI berubah dari hijau (RSI ≤30) kepada kuning (RSI ≤50) .
Amaran Risiko:
Tiada penunjuk yang sesuai untuk semua keadaan pasaran. Uji strategi ini dengan teliti dalam persekitaran demo sebelum menggunakannya dalam dagangan langsung. Penggunaan yang tidak betul boleh menyebabkan kerugian yang besar.
Ringkasan
Profil indikator
Ulasan pelanggan
0.0
Ulasan: 0
Ulasan pelanggan
Belum ada ulasan untuk produk ini. Anda sudah mencuba produk tersebut? Jadilah yang pertama untuk berkongsi pendapat anda!
Perbincangan
Soalan Lazim
Prop
Forex
Indices
Commodities
RSI
Crypto
Stocks
Produk yang tersedia melalui cTrader Store, termasuk bot dagangan, indikator dan plugin, disediakan oleh pembangun pihak ketiga dan diberikan akses untuk tujuan maklumat dan teknikal sahaja. cTrader Store bukan broker dan tidak memberikan nasihat pelaburan, syor peribadi atau sebarang jaminan prestasi masa hadapan.


Harga
Sejak 30/09/2024
44
Jualan