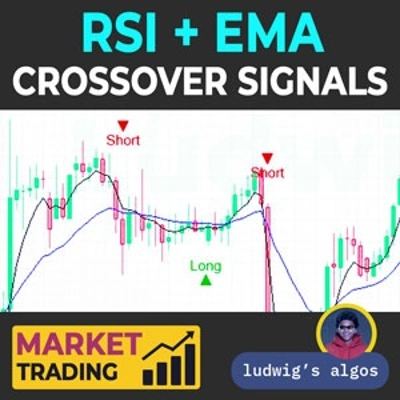
RSI - EMA Crossover Signals
Indicatore
Versione 1.0, Oct 2025
Windows, Mac
17.89M
Volume negoziato
60.07K
Profitto in pip
125
Vendite
4.67K
Installazioni gratuite
🎯 Panoramica
L'indicatore RSI + EMA Crossover Signals di LudwigICT combina momentum e conferma del trend per generare segnali di trading Long/Short ad alta affidabilità — direttamente sul tuo grafico.
⚙️ Come Funziona:
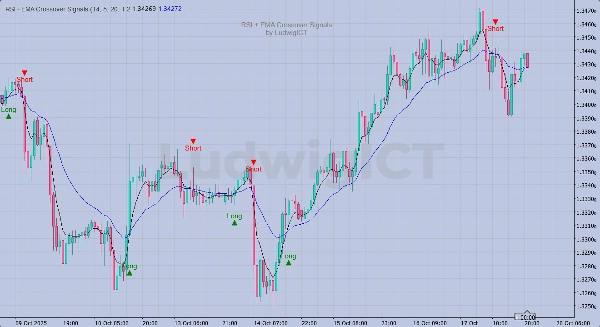
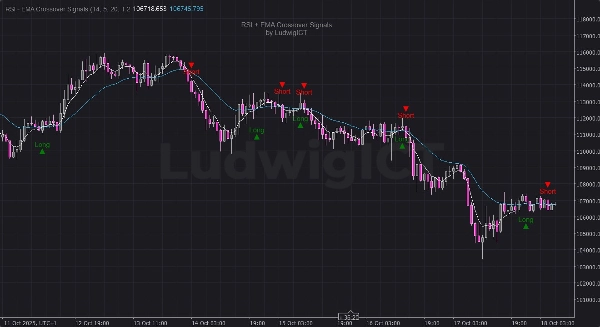
- Fase del Segnale RSI:
-
- Un segnale viene armato quando l'RSI incrocia la sua linea di segnale SMA.
- Fase di Conferma EMA:
-
- Il segnale viene attivato solo quando le EMA veloci e lente si incrociano nella stessa direzione.
- Cancellazione del Segnale:
-
- Qualsiasi incrocio opposto (RSI o EMA) annulla un segnale non attivato.
✨ Caratteristiche Principali:
- 🔁 Logica di doppia conferma (RSI + EMA)
- 📈 Icone chiare Long e Short tracciate direttamente sul grafico
- ⚡ Offset visivi dinamici basati su ATR (si adattano automaticamente alla volatilità)
- 💧 Sovrapposizione pulita con marchio a filigrana permanente
- 🧠 Logica intelligente di “armamento” e “cancellazione” per ridurre falsi segnali
- 🧮 Parametri RSI, EMA e offset completamente regolabili
🔧 Input:
- Periodo RSI (default: 14)
- EMA Veloce (default: 5)
- EMA Lenta (default: 20)
- Offset Segnale (moltiplicatore ATR, default: 1.2)
📊 Ideale Per:
- Trader di momentum
- Sistemi di conferma del trend
- Strategie di trading manuali o semi-automatizzate
📅 Aggiornamenti Versione:
- ✅ Aggiunto offset dinamico basato su ATR per una visualizzazione più chiara
- ✅ Migliorata la logica di accuratezza del segnale
- ✅ Aggiunta filigrana non rimovibile per autenticità
© 2025 LudwigICT — Tutti i diritti riservati.
Profilo indicatore
0.0
Recensioni: 0
Recensioni dei clienti
Questo prodotto non ha ancora ricevuto recensioni. L'hai già provato? Fallo sapere agli altri per primo!
BTCUSD
Forex
Signal
Breakout
Indices
EURUSD
Commodities
GBPUSD
NZDUSD
RSI
Scalping
Crypto
Stocks
XAUUSD
NAS100
ATR
MACD
USDJPY
I prodotti disponibili tramite cTrader Store, inclusi bot di trading, indicatori e plugin, sono forniti da sviluppatori terzi e resi disponibili esclusivamente a scopo informativo e di accesso tecnico. cTrader Store non è un broker e non fornisce consulenze in materia di investimento, raccomandazioni individualizzate o garanzie di risultati futuri.


17.89M
Volume negoziato
60.07K
Profitto in pip
125
Vendite
4.67K
Installazioni gratuite