
Cup Finder
Indicador
120 transferências
Versão 1.0, Feb 2026
Windows, Mac
Descrição
O Cup Finder:
É um indicador técnico de alta precisão projetado para identificar e validar estruturas de preço arredondadas — comumente conhecidas como "Cups" e "Inverted Cups" — usando geometria euclidiana e validação baseada em densidade.
📊 Análise e Condições de Mercado
https://chartshots.spotware.com/c/6980ec8b2ee38
Este indicador analisa pivôs de preço Alto e Baixo dentro de um período histórico específico. Ele procura especificamente por:
- Curvatura do Preço: Identifica picos ou vales locais (janela de 30 barras) para estabelecer a "âncora" de um padrão potencial.
- Caminho Geométrico: Projeta um arco semicircular matemático entre a âncora e o preço atual.
- Validação de Densidade: Diferente de ferramentas apenas visuais, calcula se uma porcentagem mínima de barras (Taxa de Conteúdo) permaneceu dentro de um canal de preço específico ao redor do arco.
🟢 Como Interpretar Sinais e Visuais
https://chartshots.spotware.com/c/6980ed1a2d9e9
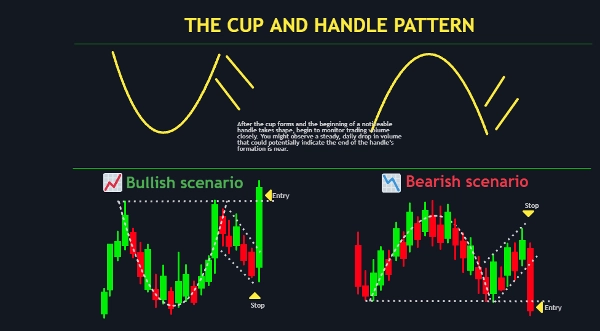
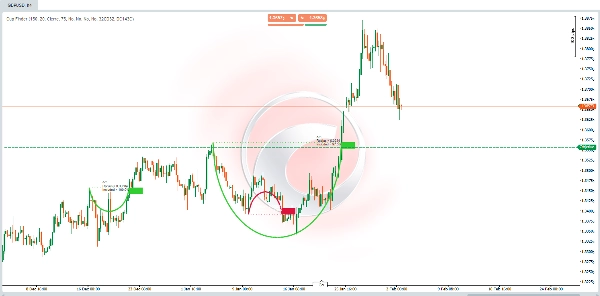
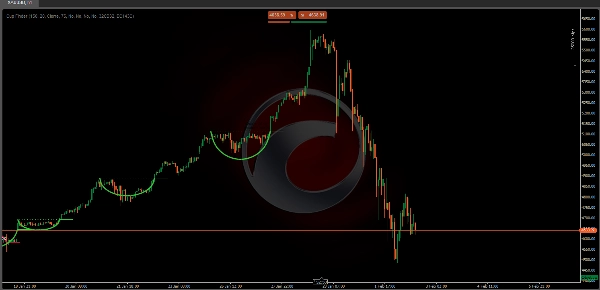
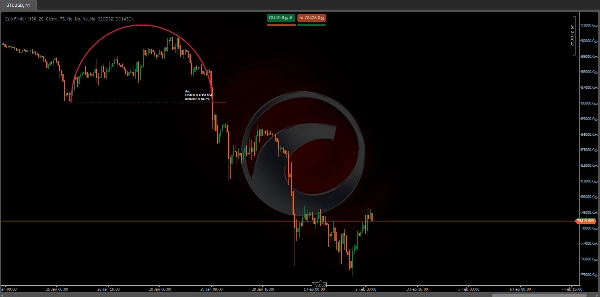
- Arcos Verdes (Altista): Indica uma formação de fundo arredondado. Procure a linha pontilhada horizontal, que representa o nível de resistência "borda".
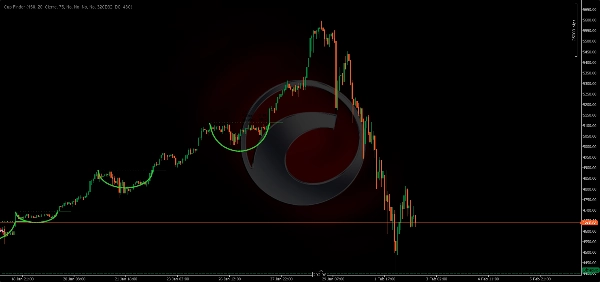
- Arcos Vermelhos (Baixista): Indica uma formação de topo arredondado (abóbada). A linha pontilhada horizontal marca o nível de suporte a ser observado.
- Rótulos de Informação:
-
- Raio: Mostra a profundidade do padrão em unidades de preço.
- % Incluído: A pontuação de "Precisão Geométrica". Uma porcentagem maior significa que o preço seguiu a curva de forma mais rigorosa.
⚙️ Configurações e Parâmetros Principais
- Período de Busca (Padrão: 150): O número de barras que o algoritmo escaneia para encontrar uma âncora histórica válida.
- Amplitude do Canal (Padrão: 20): Define a "espessura" da zona de validação do arco. Valores mais altos são mais permissivos com ruído de preço.
- Taxa de Conteúdo % (Padrão: 75): A porcentagem mínima de barras que devem permanecer dentro do arco para que ele seja exibido.
- Fonte do Breakout: Escolha se o padrão é acionado por um Fechamento ou pelo Alto/Baixo cruzando a linha da borda.
🚀 Casos de Uso e Cenários Típicos
https://chartshots.spotware.com/c/6980eefccbe38
- Negociação de Breakout: Entre em uma negociação quando o preço romper e fechar acima/abaixo da linha pontilhada horizontal (a borda).
- Identificação de Reversão de Tendência: Detectar "Fundos Arredondados" no final de uma tendência de baixa ou "Topos Arredondados" no final de uma tendência de alta.
- Suporte/Resistência Estrutural: Usar a linha da borda como um nível chave para colocar Stop Loss ou realizar lucros.
👤 Perfil do Trader Alvo
- Traders de Ação de Preço: Aqueles que buscam geometria de mercado e exaustão estrutural.
- Traders Sistemáticos: Usuários que querem eliminar a subjetividade de "desenhar cups" manualmente e preferem uma confirmação matemática.
- Nível de Experiência: Adequado para traders intermediários a avançados que entendem confirmação de breakout e conceitos de suporte/resistência.
⚠️ Limitações Importantes e Notas de Uso
- Histórico Mínimo Necessário: O indicador requer pelo menos 292 barras de dados para inicializar seus cálculos internos.
- Natureza Retardada: Como valida uma curva baseada em dados históricos, o arco só aparece quando o "arredondamento" está substancialmente desenvolvido.
- Repaint/Atualização: Conforme o preço se desenvolve, o arco pode ajustar seu raio ou desaparecer se o "% Incluído" cair abaixo do seu limite.
Resumo
Resumo de IA
Cup Finder is a technical indicator designed to identify and validate rounding price patterns known as "Cups" and "Inverted Cups" using Euclidean geometry and density-based validation. It analyzes high and low price pivots over a historical lookback period to detect price curvature by identifying local peaks or troughs within a 30-bar window, establishing an anchor point for potential patterns. The indicator projects a semicircular arc between this anchor and the current price and calculates a content rate to confirm that a minimum percentage of bars remain within a defined price channel around the arc.
Visual signals include green arcs indicating bullish rounding bottoms with a horizontal dotted resistance line, and red arcs indicating bearish rounding tops with a support line. Information labels display the pattern's radius and geometric accuracy percentage. Key adjustable parameters include search period, channel amplitude, content rate threshold, and breakout source (close or high/low crossing the rim line).
Typical use cases involve breakout trading, trend reversal identification, and defining structural support or resistance levels. The indicator targets intermediate to advanced price action and systematic traders seeking mathematical confirmation of rounding patterns. It requires at least 292 bars of historical data and may repaint or update arcs as price evolves. Supported markets include Forex, stocks, commodities, indices, and cryptocurrencies such as BTCUSD, EURUSD, GBPUSD, and XAUUSD.
Perfil do indicador
Avaliações de clientes
0.0
Avaliações: 0
Avaliações de clientes
Ainda não há avaliações para este produto. Já o experimentou? Seja o primeiro a contar a outras pessoas!
Conversa
Perguntas frequentes
BTCUSD
Forex
Breakout
Indices
EURUSD
Commodities
GBPUSD
NZDUSD
Prop
Crypto
Stocks
XAUUSD
NAS100
USDJPY
Os produtos disponíveis através da cTrader Store, incluindo bots de negociação, indicadores e plugins, são fornecidos por programadores terceiros e são disponibilizados apenas para fins informativos e de acesso técnico. A cTrader Store não é um corretor e não fornece aconselhamento em matéria de investimento, recomendações pessoais ou qualquer garantia de desempenho no futuro.


Preço
Desde 03/10/2024
163
Vendas
38.54K
Instalações gratuitas