TMA Bands Essentials
مؤشر
28 التنزيلات
الإصدار 1.0، Feb 2026
Windows, Mac
صورة "TMA Bands Essentials" المحملةصورة "TMA Bands Essentials" المحملةصورة "TMA Bands Essentials" المحملةصورة "TMA Bands Essentials" المحملةصورة "TMA Bands Essentials" المحملةصورة "TMA Bands Essentials" المحملة
2
المبيعات
231
التثبيتات المجانية

Description:

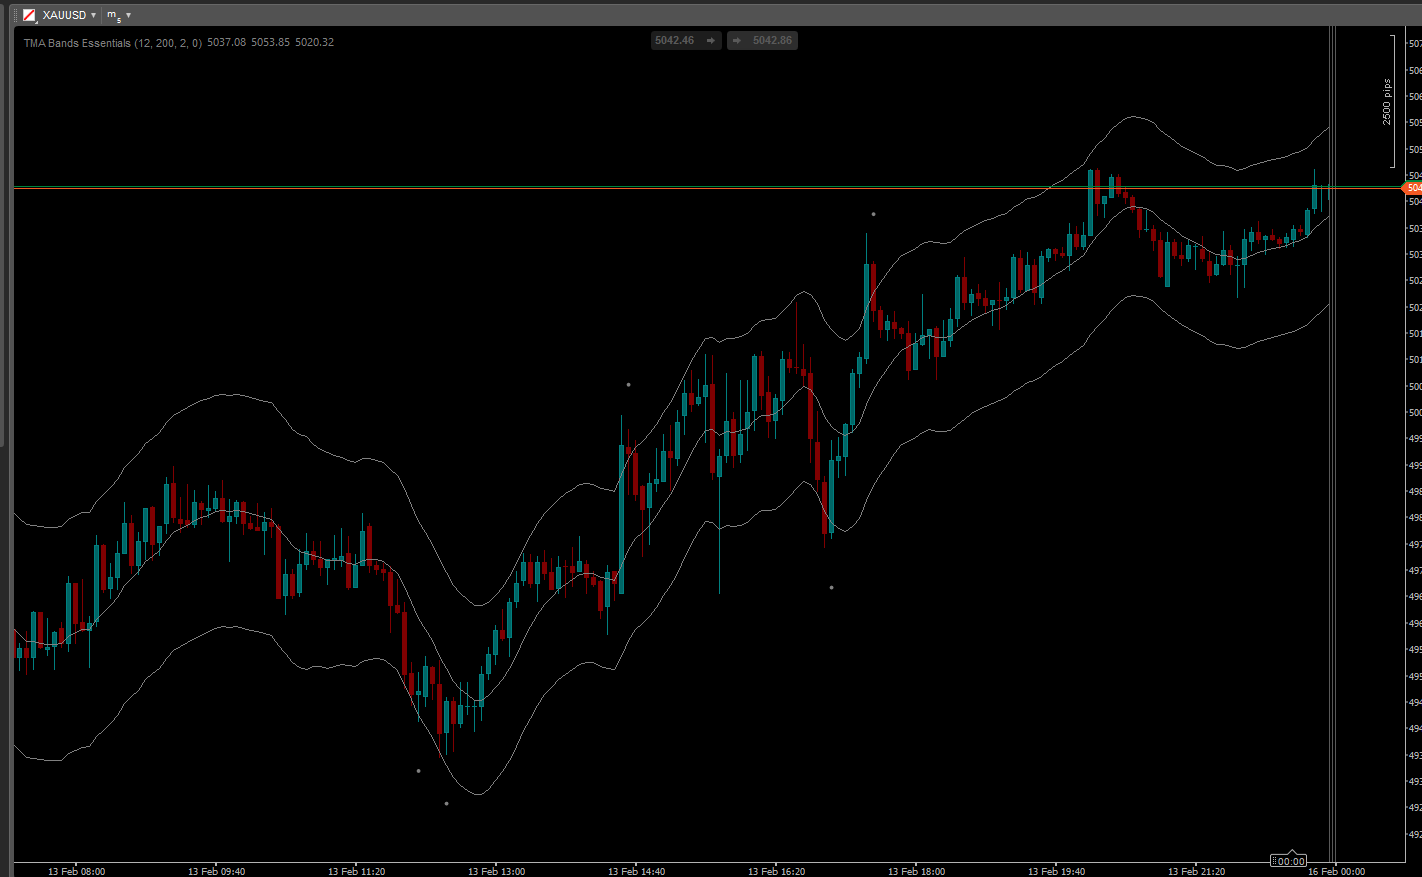
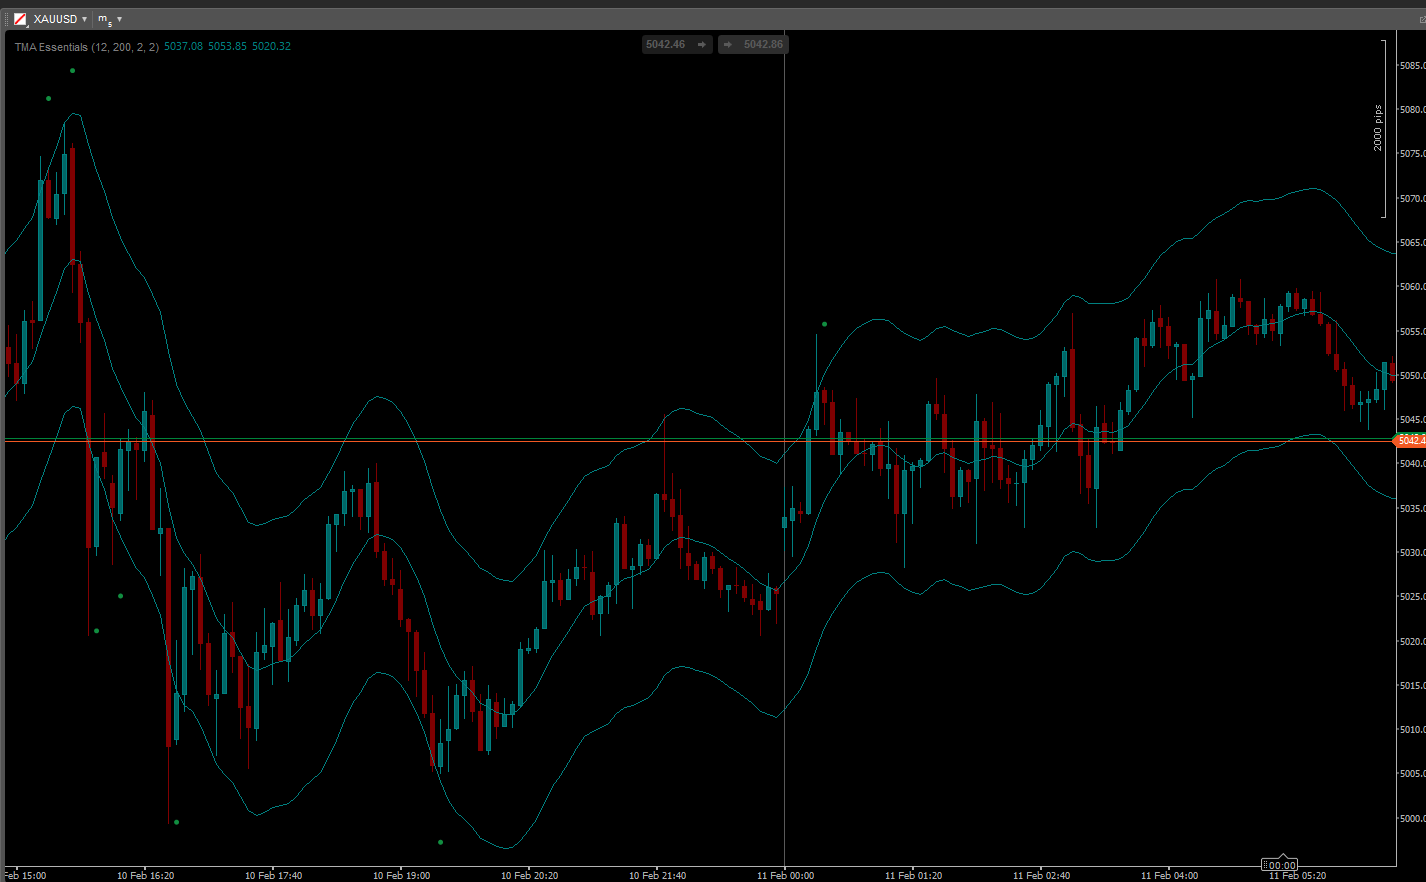
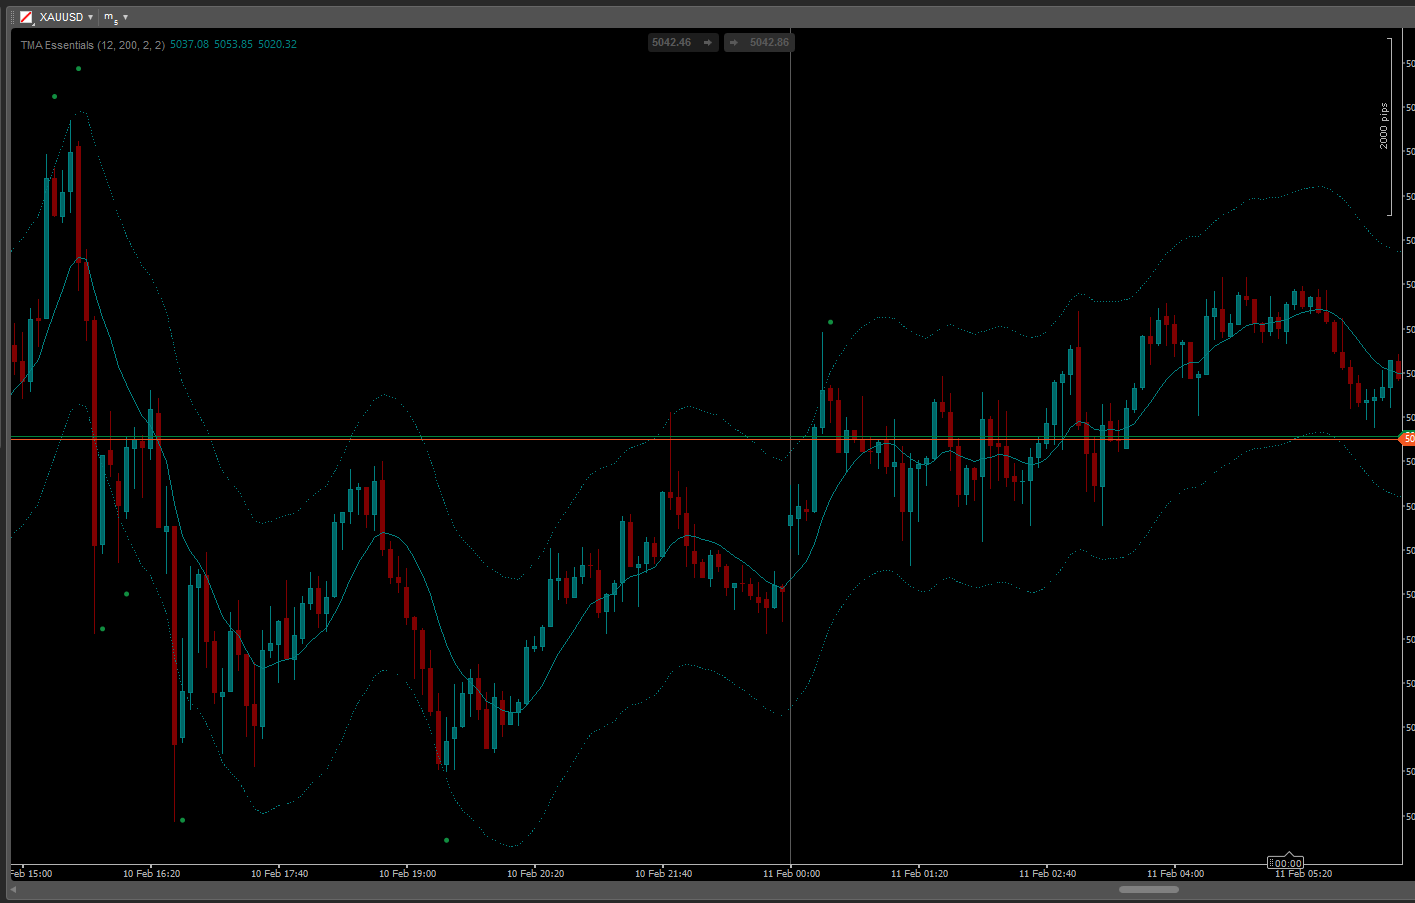
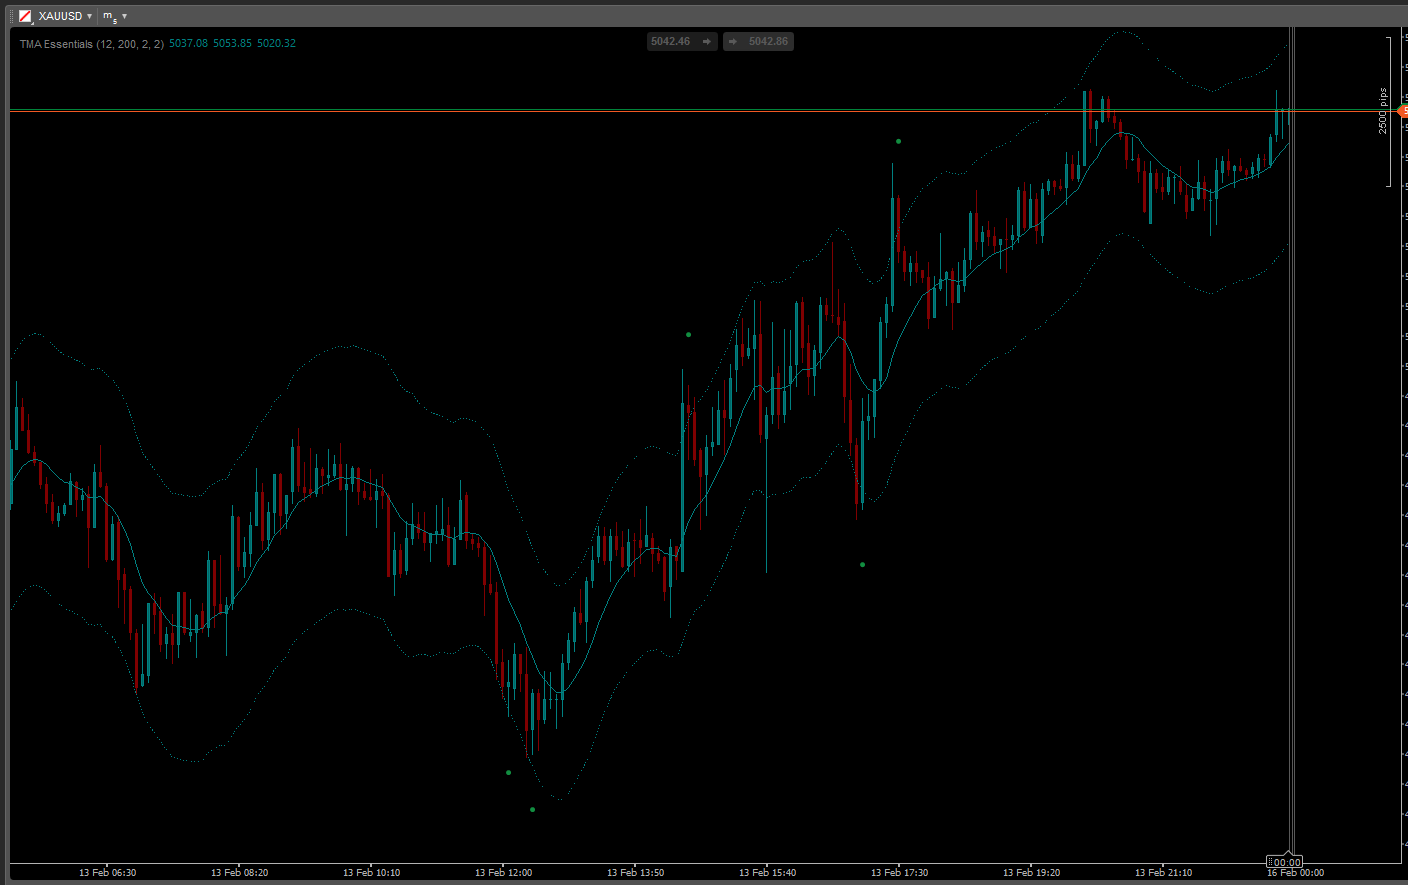
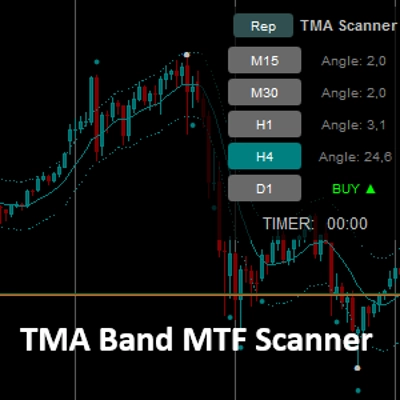
TMA Band Essentials is a sophisticated technical indicator designed for cTrader, focused on "Mean Reversion" strategies. It combines the smoothness of the Triangular Moving Average (Centered TMA) with dynamic volatility bands based on ATR (Average True Range).

This tool doesn't just draw lines; it actively scans for high-probability reversal setups by combining three critical factors: Band Interaction, Candle Patterns, and Trend Angle.

Key Features:

  • Weighted Centered TMA: Uses a precise Weighted Price formula (High + Low + 2*Close) / 4 for the smoothest center line representation.
  • Dynamic ATR Bands: Automatically adjusts channel width based on market volatility (ATR), helping you identify true Overbought and Oversold zones.
  • Smart Signal Logic ("Caution"): The indicator plots signals only when specific price action criteria are met (Band breakout + Reversal Candle pattern).
  • Angle Filtering: Includes a built-in filter to ignore signals when the trend slope is too flat, ensuring you trade with momentum logic.

How to Trade:
The indicator provides "Caution" signals (gray points) suggesting a potential market reversal:

  1. Price touches the Upper Band: If the previous candle breaks the band and the current candle shows a bearish reversal pattern, a signal is generated (potential Short).
  2. Price touches the Lower Band: If the previous candle breaks the band and the current candle shows a bullish reversal pattern, a signal is generated (potential Long).
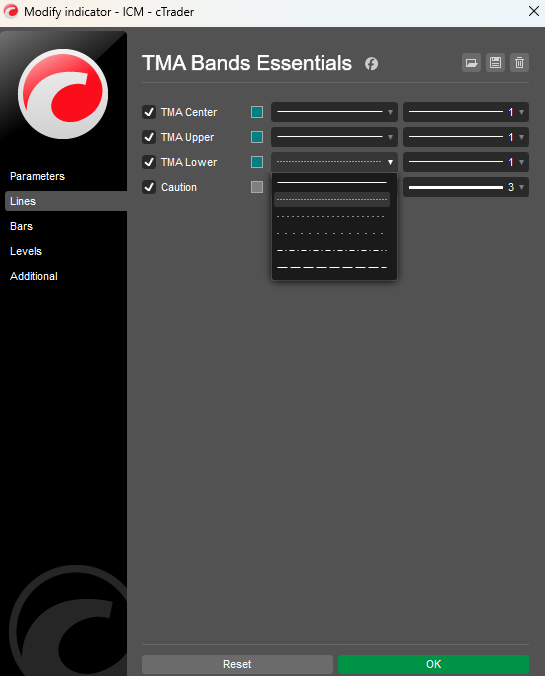
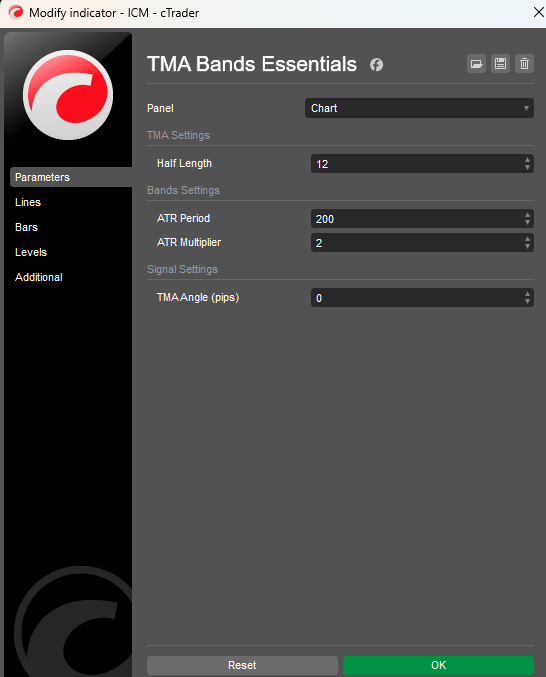
Parameters:

  • Half Length: Controls the smoothness of the TMA Center line.
  • ATR Period & Multiplier: Defines the sensitivity and width of the volatility bands.
  • TMA Angle (pips): Minimum slope required to validate a signal (filters out noise).

Note: This indicator uses a Centered TMA calculation method to visualize the true market flow.

0.0
التقييمات: 0
تقييمات العملاء
لا توجد تقييمات لهذا المنتج حتى الآن. هل جرَّبته بالفعل؟ كن أول من يخبر الآخرين!
Breakout
ATR
Signal

المزيد من هذا المؤلف

مؤشر
Grid
Indices
+7
Follow The Trend cBot - INDICATOR - displays two Moving Average Bands for cBot or for your own use
شعار "EMA MTF TREND"
مشهور
نسخة مجانية
$ 20
/
$25
مؤشر
XAUUSD
Prop
+7
EMA Clouds, Multi-Timeframe (MTF) Overlay, Swing High/Low detection, and a smart Dashboard with neutral zone filtering.
مؤشر
Prop
XAUUSD
+8
The EMA Trend Simple is a trend-following tool designed for simplicity and visual clarity.
شعار "EMA MTF Trend Pro"
مشهور
نسخة مجانية
$ 49
/
$75
مؤشر
RSI
XAUUSD
+7
EMA MTF TREND PRO - Multi-timeframe trend analysis overlay indicator, 6 timeframes - in one table with ADX
مؤشر
XAUUSD
Breakout
+5
TMA Band MTF Scanner – Ultimate Reversal & Trend Dashboard
شعار "Weekly Opening Gaps"
جديد
نسخة مجانية
$ 25
/
$35
مؤشر
NAS100
Indices
+4
Weekly Daily Opening Gaps — NWOG & NDOG Indicator Professional-grade opening gap visualization for institutional traders
شعار "HLC_Levels"
نسخة مجانية
$ 20
/
$25
مؤشر
NAS100
Indices
+7
The ultimate tool for Price Action and ICT. High, Low and Mid levels for days, weeks Inc. NY Midnight and Custom Range.
cBot
Grid
Breakout
+12
FOLLOW THE TREND XAU EDITION Professional Automated Gold Trading Robot for traders. Works on indices and forex pairs too
6.67
عامل الربح
2.66%
أقصى تراجع
شعار "ORB Levels PRO"
نسخة مجانية
$ 19
/
$25
مؤشر
NAS100
XAUUSD
+2
ORB Levels PRO – Advanced Opening Range Breakout Tool Master the Market Open with Precision. Europe & US Opening Ranges

قد يعجبك أيضًا

مؤشر
Indices
Stocks
+2
PREMIUN INDICATOR
مؤشر
NZDUSD
Breakout
+8
Utilize support and resistance levels across various timeframes, including large, range, and tick charts
مؤشر
NAS100
NZDUSD
+12
A clean, real-time risk HUD designed to prevent prop firm account failure and protect your challenge account.
مؤشر
NAS100
Breakout
+12
Multi-Timeframe Rolling Volatility Indicator - Smart Volatility Breakout System
مؤشر
Indices
Stocks
+3
Volume profiler applying Wyckoff effort vs result and spread analysis with visual bar graphs.
شعار "FairValueGap"
الأعلى تقييمًا
4.5
(2)
مجاني
This Fair Value Gap (FVG) indicator is a technical analysis tool used to identify potential price imbalances.
moving average cloud. you could change cloud color.
Market entropy + DC. Spot crystallization/chaos shifts with an optional on-chart overlay.
شعار "VegaXLR - cTrader Chart Themes"
الأعلى تقييمًا
5.0
(2)
مجاني
مؤشر
Indices
Prop
+4
Free chart themes for the cTrader platform.
A function demo version of VWAP indicator with std. dev. bands. Expired on 1st Aug, 2025.
Session VWAP Profile - Daily(standard deviations), Weekly, Monthly, Quarterly, Yearly
مؤشر
RSI
EURUSD
+1
Precision Supply & Demand zones indicator—automatically plots key buy/sell areas on your chart for smarter entries.
2
المبيعات
231
التثبيتات المجانية