Описание
Динамика прогноза цены 📈🔮
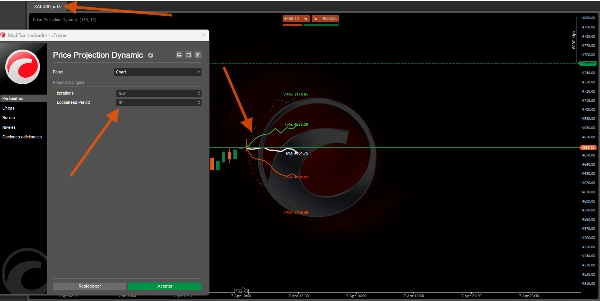
https://chartshots.spotware.com/c/69d5304ea1cc1
Что это?
https://chartshots.spotware.com/c/69d52fb4b01cd
Динамика прогноза цены — это индикатор наложения, который прогнозирует статистически вероятные будущие пути цены с помощью моделирования Монте-Карло и оценивает направленную предвзятость через байесовский классификатор вероятностей. Он отвечает на один вопрос: учитывая, как этот актив двигался, куда он статистически вероятнее всего пойдет дальше? 📊
https://chartshots.spotware.com/c/69d53010d38ce
Как это работает ⚙️
Двигатель 1 — Проекция Монте-Карло 🎲
Индикатор анализирует недавнюю историю цен и извлекает логарифмические доходности. Он вычисляет среднюю доходность и её стандартное отклонение — учитывая как дрейф (тенденцию), так и волатильность (неустойчивое движение) 🌪️.
Он запускает 200 смоделированных путей цены (до 500) в будущее. Каждая симуляция — это "случайное блуждание" на основе реального недавнего движения. Из них индикатор извлекает 5 процентильных диапазонов:
Диапазон
Значение
95%
Оптимистичный экстремум — только 5% симуляций были выше 🚀
75%
Верхний вероятный диапазон — цена завершилась выше этого в 25% симуляций 📈
50% (MD)
Медианная проекция — статистический центр всех исходов 🎯
25%
Нижний вероятный диапазон — цена завершилась ниже этого в 25% симуляций 📉
05%
Пессимистичный экстремум — только 5% симуляций были ниже 📉🛑
Полезный совет: Чем шире раскрывается веер, тем выше текущая волатильность 📢. Узкий веер означает, что актив движется предсказуемо 🧵.
Двигатель 2 — Байесовский классификатор 🧠
Независимо от проекции, этот двигатель классифицирует рынок как бычий или медвежий, делая следующее:
- Оценивает окно в прошлом (по умолчанию 500 баров) 🔍.
- Измеряет относительный объем и моментум для бычьих и медвежьих баров.
- Вычисляет, к какому профилю текущий бар подходит лучше, используя гауссову вероятность ⚖️.
Результат — это процент вероятности выигрыша:
Вероятность
Интерпретация
> 70%
Высокая уверенность в бычьем тренде ✅🟢
50–70%
Умеренно / неясно ⚖️🟡
< 30%
Высокая уверенность в медвежьем тренде ✅🔴
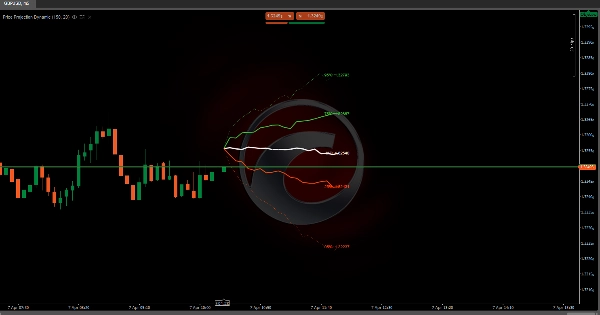
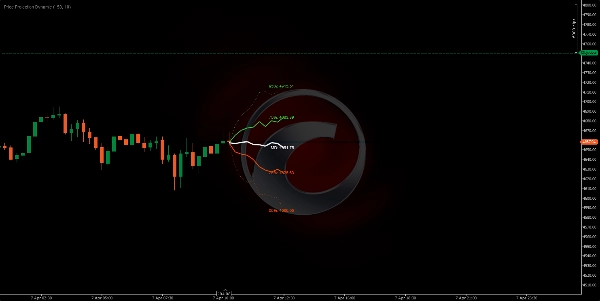
Визуальные элементы 🎨
- Зеленые линии (75%, 95%): Верхние проекционные диапазоны — бычий диапазон 🍏
- Белая линия (MD): Медианная проекция цены — наиболее вероятный путь 🏁
- Оранжевые линии (25%, 05%): Нижние проекционные диапазоны — медвежий диапазон 🍊
- Пунктирные внешние линии: 95% и 05% экстремумы (границы с низкой вероятностью) ⚠️
- Сплошные внутренние линии: 75%, 50%, 25% (зона высокой вероятности) ✅
- Ценовые метки: Точная проекция цены для каждого процентиля 🏷️
- Информационная панель (вверху справа): Байесовская вероятность выигрыша, медианная цель, относительный объем, направление сигнала 🖥️
Как использовать 📖
- Читайте форму веера 📢 — если он быстро расширяется, волатильность высокая, и проекции менее определены.
- Используйте медианную линию (MD) 🎯 как наиболее статистически вероятную будущую цель цены.
- Используйте диапазоны 75%/25% 📏 как реалистичные верхние/нижние цели для сделок.
- Используйте диапазоны 95%/05% 🛑 как экстремальные границы — полезно для установки стоп-лоссов.
- Проверяйте байесовскую панель 🧠 — вероятность выше 70% или ниже 30% добавляет уверенности в направлении.
- Комбинируйте оба двигателя 🤝 — если медианная линия наклонена вверх И байесовская вероятность > 70%, настройка статистически сильна.
Ключевые параметры ⚙️
Параметр
Что контролирует
Большее значение
Меньшее значение
Итерации
Количество смоделированных путей
Более плавные диапазоны 🌊
Более быстрая вычислительная скорость ⚡
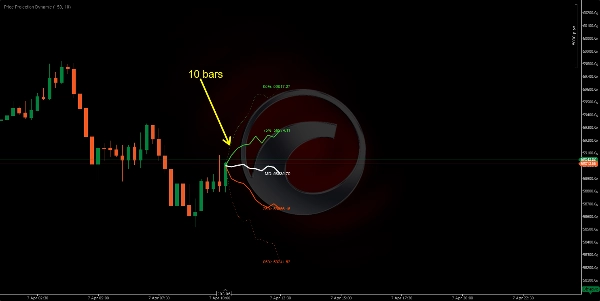
Прогноз на будущее
Дистанция будущей проекции
Длинный горизонт 🔭
Короткий, более надежный 🔍
Глубина выборки
Недавние бары для анализа
Долгосрочное поведение 🐢
Только недавнее поведение 🐇
Окно классификатора
Байесовская история
Более стабильная вероятность ⚖️
Более реактивная ⚡
Профиль индикатора 📋
- Категория индикатора: Статистика 📊
- Тип вывода: Визуализация и сигналы 🖼️
- Требования к данным: Только бары 📶
Отказ от ответственности ⚠️
Этот индикатор прогнозирует статистические вероятности, а не предсказания 🔮. Моделирование Монте-Карло предполагает, что будущее будет похоже на недавнее прошлое — это нарушается во время черных лебедей 🦢 или гэпов, вызванных новостями. Используйте как вероятностную основу вместе с вашим собственным управлением рисками 🛡️.
Сводка
Separately, the Bayesian classifier evaluates market sentiment by analyzing relative volume and momentum over a configurable window, providing a win probability percentage that indicates bullish or bearish confidence. Visual elements include color-coded projection bands (green for bullish, orange for bearish), a median price line, price labels for each percentile, and an info panel displaying Bayesian probability and other metrics.
Key adjustable parameters include the number of simulation iterations, projection horizon, sample depth of historical bars, and classifier window size. The indicator requires bar data with volume and outputs visual projections and directional signals. It is designed to offer a probabilistic framework for anticipating price movement based on recent market behavior, suitable for various symbols including BTCUSD, EURUSD, GBPUSD, XAUUSD, NAS100, and others.
Отзывы покупателей
5 | 0 % | |
4 | 100 % | |
3 | 0 % | |
2 | 0 % | |
1 | 0 % |