Описание
ДОСТУПНА РАСШИРЕННАЯ ВЕРСИЯ — ЗДЕСЬ
Вы сейчас просматриваете оригинальную версию. Расширенная версия этого индикатора выпущена с дополнительными функциями:
- Улучшенное отображение возраста: формат лет, месяцев, недель, дней (например, "3г 2н 4д")
- Показать все FVG: установите "FVG для отображения" в -1, чтобы показать неограниченное количество исторических FVG
- Расширение заполненных FVG: опция расширения заполненных FVG-боксов до текущего бара
- Уровни Фибоначчи: автоматические уровни (23.6%, 38.2%, 50%, 61.8%, 78.6%) на частичных и заполненных FVG
- Порог частичного заполнения: настраиваемый порог (50-99%, по умолчанию 90%)
__________________________________________________________________________________________
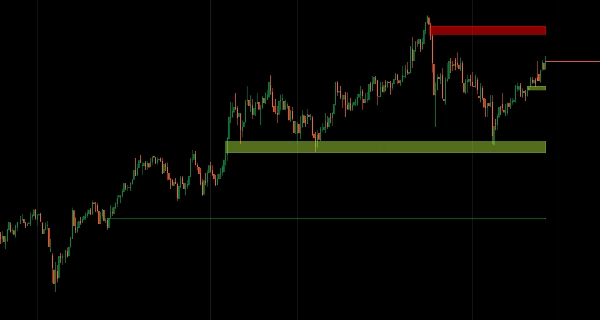
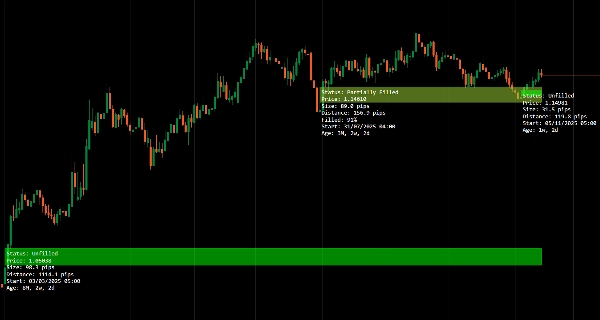
Определяйте Fair Value Gaps с отслеживанием возраста и мониторингом статуса заполнения.
Автоматически обнаруживает бычьи и медвежьи гэпы, отслеживает их поведение заполнения (незаполненные, частично заполненные, полностью заполненные) в реальном времени и отображает возраст гэпа для приоритизации.
Сканирование на нескольких таймфреймах для согласования структурных гэпов высокого таймфрейма с ценовым движением низкого таймфрейма, динамическое обновление статуса при взаимодействии цены с зонами и минимальное ненавязчивое маркирование обеспечивают сфокусированный анализ дисбаланса ликвидности для трейдеров, ориентированных на заполнение гэпов и входы на основе структуры.
ФУНКЦИИ
Определение FVG
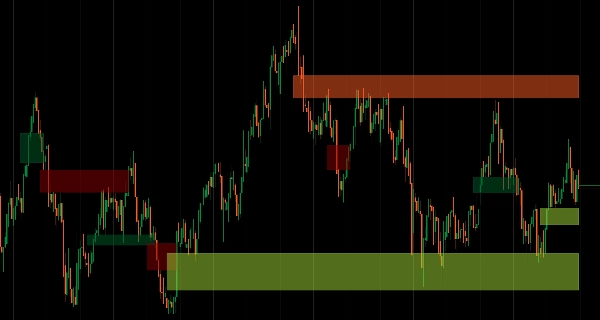
- Автоматически обнаруживает бычьи и медвежьи Fair Value Gaps
- Отслеживает статус незаполненных, частично заполненных и полностью заполненных в реальном времени
- Чистое визуальное отображение с минимальным загромождением графика
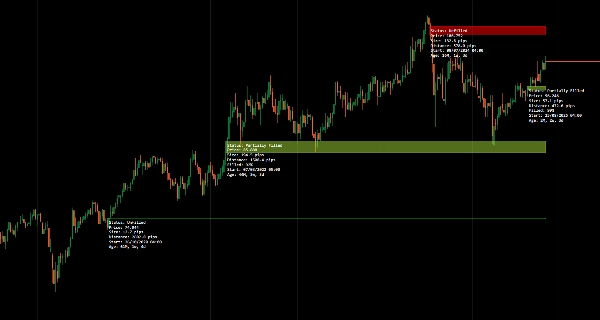
Маркировка возраста
- Отображает, сколько времени прошло с момента формирования каждого гэпа
- Помогает приоритизировать свежие и устаревшие гэпы для выбора сделок
- Временной контекст улучшает принятие решений о релевантности гэпа
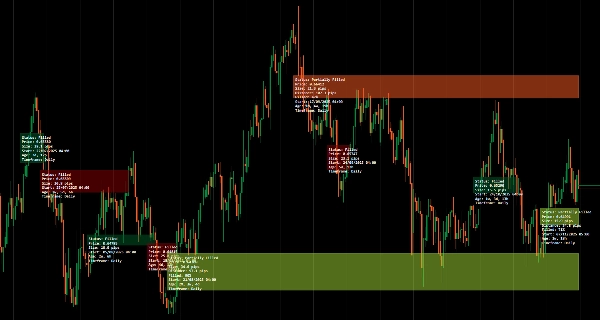
Отслеживание статуса
- Показывает текущий статус заполнения: незаполненный, частично заполненный или полностью заполненный
- Динамически обновляется при взаимодействии цены с гэпом
- Визуальное подтверждение захвата ликвидности
Режим мульти-таймфрейма
- Сканирование и отображение FVG высокого таймфрейма на графиках низкого таймфрейма
- Согласование структурных гэпов HTF с ценовым движением LTF
- Улучшает рабочий процесс анализа на нескольких таймфреймах
Чистый, минималистичный интерфейс
- Ненавязчивые метки, разработанные для ясности
- Информативно, без загромождения вашего ценового просмотра
- Профессиональная презентация для сфокусированного анализа
__________________________________________________________________________________________
БОЛЬШЕ БЕСПЛАТНЫХ ИНДИКАТОРОВ
Изучите широкий спектр инструментов анализа рынка — от структуры и объема до регрессии, волатильности и пользовательских таймфреймов.
Исходный код доступен в репозитории на GitHub repository.
Все бесплатно для использования. Но если хотите поддержать кофе, можете отправить поддержку здесь.
Поддержка/Сопротивление
Объем
- Volume Activity Profiler
- Volume Efficiency Analyzer
- Volume Profile Analytics
- Volume Profile - обновлено
- Volume Spread Analysis
- VWAP (средневзвешенная цена по объему)
Скользящие средние
- Anchored Moving Average
- Deviation-Scaled Moving Average
- Instantaneous Trendline
- Kaufman Adaptive MA с Trend Vision
- Moving Average Channel
- Набор скользящих средних
- Trend Channel Moving Average
Утилиты/Пользовательские
На основе регрессии
Волатильность
Осцилляторы
__________________________________________________________________________________________
ОТКАЗ ОТ ОТВЕТСТВЕННОСТИ
Торговля связана с риском. Этот индикатор предназначен только для технического анализа — всегда применяйте надлежащее управление рисками и торгуйте ответственно.
ОБРАТНАЯ СВЯЗЬ И УЛУЧШЕНИЯ
Если у вас есть предложения, запросы функций или идеи для улучшения, пожалуйста, оставьте комментарий во вкладке Обсуждение. Ваш отзыв помогает улучшить индикатор для всех.
Сводка
Отзывы покупателей
5 | 100 % | |
4 | 0 % | |
3 | 0 % | |
2 | 0 % | |
1 | 0 % |