
Описание
Панель управления графиком для более быстрой навигации — масштабирование, временные интервалы и настройка графика без выхода из графика.
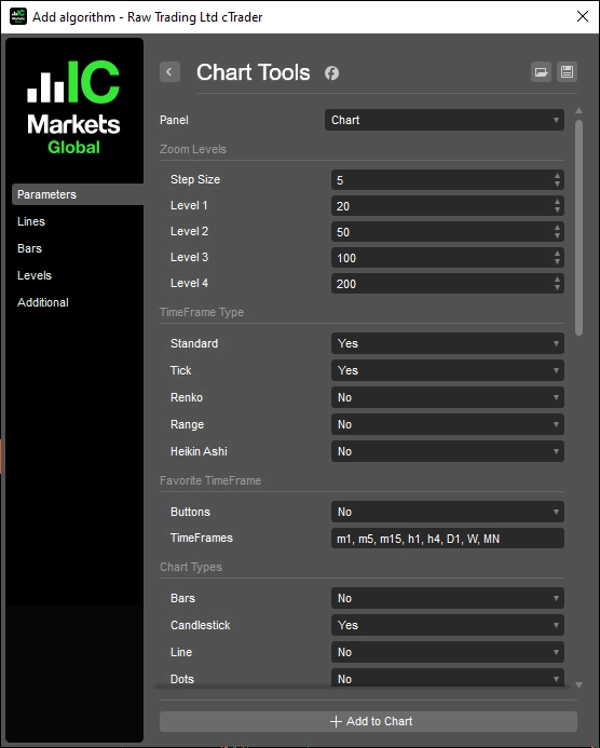
Предустановки масштабирования, ручной ввод масштаба, полный выбор временных интервалов и графиков, настраиваемые избранные временные интервалы, разделители периодов, сетка с круглыми числами и линии живых заявок на покупку/продажу — всё доступно через кнопки интерфейса на графике. Разработано для сокращения времени навигации по стандартным меню cTrader во время активных торговых сессий.
ОСОБЕННОСТИ
Управление масштабом
- Увеличение / уменьшение масштаба с настраиваемым шагом
- Четыре настраиваемых предустановленных уровня масштабирования для быстрого доступа
- Ручной ввод масштаба с кнопкой применения
- Синхронизация с нативными событиями масштабирования cTrader
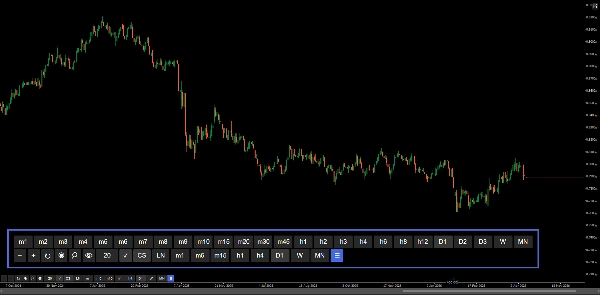
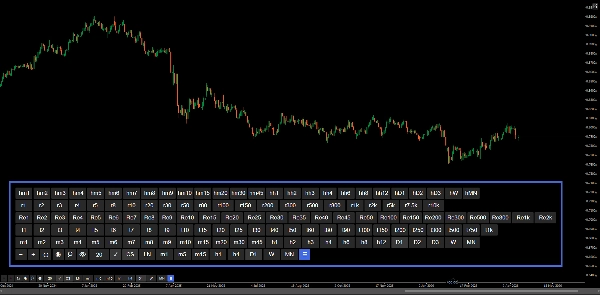
Выбор временного интервала
- Полная панель кнопок, охватывающая все типы временных интервалов: стандартные, Heikin Ashi, Renko, Range, Tick
- Режим "Все" отображает каждый тип отдельными строками
- Активный временной интервал выделяется автоматически
- Переключение видимости панели кнопкой ☰
Избранные временные интервалы
- Настраиваемая строка быстрого доступа через ввод через запятую (например, m1, h1, D1)
- Поддержка всех типов временных интервалов, включая Range и Tick
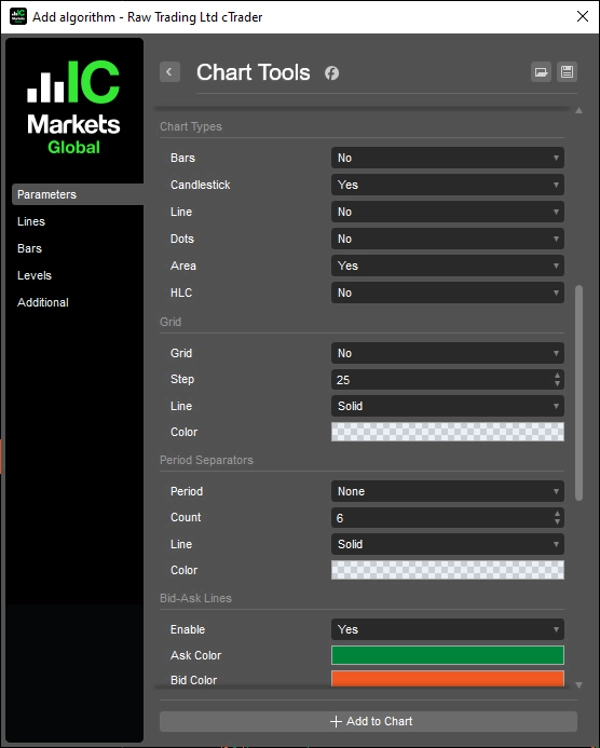
Тип графика
- Кнопки быстрого переключения для: Bars, Candlestick, Line, Dots, Area, HLC
- Активный тип графика выделяется автоматически
- Каждая кнопка настраивается индивидуально через параметры
Сетка
- Сетка на основе круглых чисел с настраиваемым интервалом в пипах (множитель)
- Ценовые метки с умным форматированием десятичных знаков
- Линии продолжаются на 10 баров за последний бар
- Переключатель включения/отключения
Разделители периодов
- Разделители: дневные, недельные, месячные и годовые
- Настраиваемое количество, цвет, стиль линии и толщина
- Автоматическое обновление при прокрутке и масштабировании
Линии Bid/Ask
- Линии живых заявок на покупку и продажу, продолжающиеся до бесконечности
- Настраиваемые цвета для ask и bid
- Переключатель включения/отключения
Кнопки
- Позиция: верхний правый, верхний левый, нижний правый, нижний левый
- Настраиваемые отступы
- Настраиваемые цвета кнопок и текста — включая активное состояние, применение масштаба и кнопку переключения графика
__________________________________________________________________________________________
БОЛЬШЕ БЕСПЛАТНЫХ ИНДИКАТОРОВ
Изучите широкий спектр инструментов анализа рынка — от структуры и объема до регрессии, волатильности и пользовательских временных интервалов.
Исходный код доступен в репозитории на GitHub repository.
Все бесплатно для использования. Но если хотите поддержать проект чашечкой кофе, можете сделать это здесь.
Поддержка/Сопротивление
Объем
- Volume Activity Profiler
- Volume Efficiency Analyzer
- Volume Profile Analytics
- Volume Profile - Updated
- Volume Spread Analysis
- VWAP (Volume Weighted Average Price)
Скользящие средние
- SSL Channel
- Anchored Moving Average
- Deviation-Scaled Moving Average
- Gann High Low Activator
- Instantaneous Trendline
- Kaufman Adaptive MA with Trend Vision
- Moving Average Channel
- Moving Averages Suite
- Trend Channel Moving Average
Утилиты/Пользовательские
Регрессия
Волатильность
Осцилляторы
__________________________________________________________________________________________
ОТКАЗ ОТ ОТВЕТСТВЕННОСТИ
Торговля связана с риском. Этот индикатор предназначен только для технического анализа — всегда применяйте надлежащее управление рисками и торгуйте ответственно.
ОБРАТНАЯ СВЯЗЬ И УЛУЧШЕНИЯ
Если у вас есть предложения, запросы на функции или идеи по улучшению, пожалуйста, оставьте комментарий во вкладке Обсуждение. Ваш отзыв помогает улучшить индикатор для всех.
Сводка
Отзывы покупателей
5 | 100 % | |
4 | 0 % | |
3 | 0 % | |
2 | 0 % | |
1 | 0 % |


![Логотип продукта "High-Low Divergence [Iridio Capital]"](https://cdn.ctrader.com/image/webp/443c4661-7abb-40f1-842f-4b6ec560649b_40914)


