
Description
VOLUME HEATMAP PRO - Visualisation professionnelle de la densité du marché
Découvrez le marché comme jamais auparavant avec cette carte thermique de volume avancée qui transforme des données de volume complexes en une représentation visuelle intuitive. Contrairement aux indicateurs de volume traditionnels qui n'affichent que des barres en bas de votre graphique, Volume Heatmap Pro révèle exactement où les traders institutionnels accumulent et distribuent des positions à chaque niveau de prix.
CARACTÉRISTIQUES PRINCIPALES :
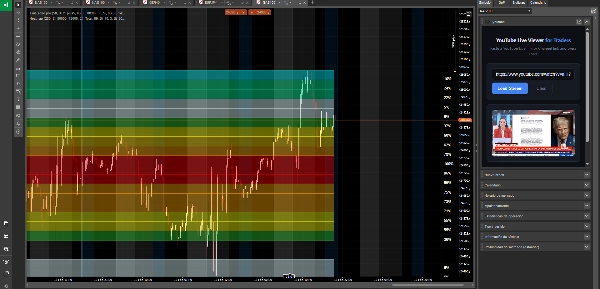
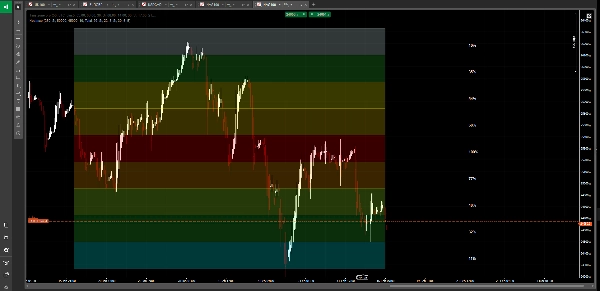
🔥 Carte thermique codée par couleur dynamique
Découvrez l'analyse du volume grâce à un système de dégradé de couleurs en 10 niveaux époustouflant. Du bleu glacé (activité minimale) au rouge flamboyant (volume maximal), identifiez instantanément où l'argent important circule. La carte thermique se met à jour en temps réel, vous montrant la densité du marché en un coup d'œil.
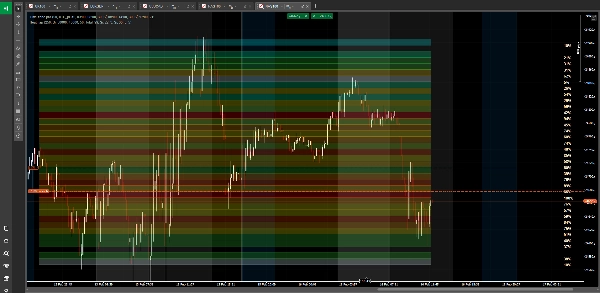
📍 Détection du Point de Contrôle (POC)
Identifie et met automatiquement en évidence le niveau de prix avec le volume de trading le plus élevé - le véritable point d'équilibre du marché. C'est là que les institutions ont construit leurs plus grandes positions et où le prix a tendance à revenir.
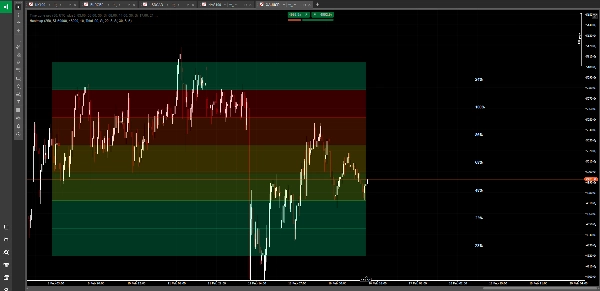
🎯 Distribution du volume à plusieurs niveaux
Divise votre fourchette de prix en jusqu'à 50 niveaux précis, créant une carte détaillée de la distribution du volume. Voyez exactement quels prix ont attiré un fort volume de trading et lesquels ont été ignorés par le marché.
📊 Trois modes d'analyse du volume
• Volume total - Voir toute l'activité du marché
• Volume d'achat uniquement - Isoler les zones de pression haussière
• Volume de vente uniquement - Identifier les zones de distribution baissière
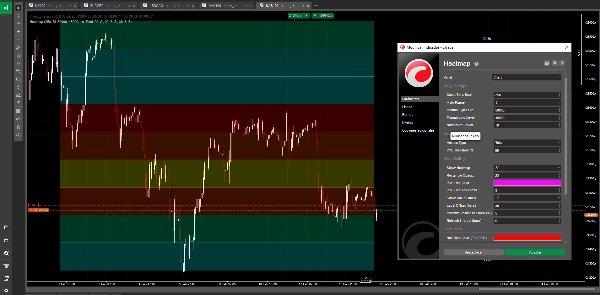
🎨 Visualisation professionnelle
• Rectangles codés par couleur couvrant votre période d'analyse
• Opacité ajustable pour une intégration parfaite au graphique
• Étiquettes optionnelles de pourcentage de volume sur chaque niveau
• Ligne POC personnalisable avec contrôle de l'épaisseur
• Affichage propre et non intrusif
⚙️ Technologie intelligente d'auto-plage
Calcule automatiquement la plage de prix optimale à partir de votre période de retour en arrière, ou définissez manuellement votre propre plage pour une analyse spécifique. La carte thermique s'adapte à toute condition de marché ou intervalle de temps.
🔄 Performance optimisée
Les intervalles de rafraîchissement configurables garantissent une performance fluide du graphique tout en maintenant une analyse précise du volume. Analysez jusqu'à 500 barres en arrière sans latence.
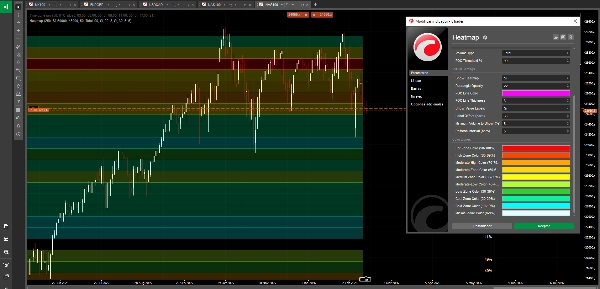
📈 Zones de couleur personnalisables
Personnalisez les 10 zones de couleur pour correspondre à vos préférences visuelles :
• Zone chaude (90-100%) - Concentration maximale de volume
• Zone haute (80-89%) - Forte activité
• Modéré-haut (70-79%) - Volume supérieur à la moyenne
• Modéré (60-69%) - Activité solide
• Moyen (50-59%) - Volume moyen
• Modéré-bas (40-49%) - En dessous de la moyenne
• Zone basse (30-39%) - Activité légère
• Zone fraîche (20-29%) - Trading minimal
• Zone froide (10-19%) - Volume très faible
• Minimal (0-9%) - Presque aucune activité
PARFAIT POUR :
• Identifier les zones d'accumulation et de distribution institutionnelles
• Trouver les nœuds à faible volume pour des zones potentielles de rupture
• Repérer les niveaux de support et résistance à fort volume
• Comprendre la structure du marché et la liquidité
• Confirmer les entrées de trade dans les zones à fort volume
• Éviter les zones pièges à faible liquidité
• Analyse du profil de volume multi-échelle
CE QUI LE REND DIFFÉRENT :
Les indicateurs de volume traditionnels vous montrent combien a été échangé, mais pas où. Volume Heatmap Pro révèle l'image complète - une carte de densité visuelle montrant exactement quels niveaux de prix ont absorbé le plus d'activité de trading. Le système de dégradé de couleurs rend l'analyse complexe du volume aussi simple que la lecture d'une carte météo. Le rouge signifie chaud (volume élevé), le bleu signifie froid (volume faible).
Que vous scalpez des retournements intrajournaliers ou que vous vous positionniez pour des trades de swing, cette carte thermique vous montre où le marché a une véritable conviction par rapport à là où ce n'est que du bruit.
---
⚠️ AVERTISSEMENT SUR LES RISQUES :
Le trading de devises étrangères, de cryptomonnaies et d'autres instruments financiers comporte un niveau de risque élevé et peut ne pas convenir à tous les investisseurs. Le degré élevé de levier peut jouer contre vous aussi bien qu'en votre faveur. Avant de décider de trader, vous devez soigneusement considérer vos objectifs d'investissement, votre niveau d'expérience et votre appétit pour le risque. Il est possible que vous subissiez une perte partielle ou totale de votre investissement. Par conséquent, vous ne devriez pas investir de l'argent que vous ne pouvez pas vous permettre de perdre. Vous devez être conscient de tous les risques associés au trading et demander conseil à un conseiller financier indépendant si vous avez des doutes. Les performances passées ne préjugent pas des résultats futurs.
Résumé
Key features include automatic Point of Control (POC) detection, highlighting the price level with the highest trading volume, and multi-level volume distribution dividing the price range into up to 50 levels for detailed analysis. It supports three volume modes: total volume, buy volume only, and sell volume only, enabling users to isolate bullish or bearish pressure zones.
The indicator offers professional visualization with adjustable opacity, customizable color zones, optional volume percentage labels, and a customizable POC line. Smart auto-range technology calculates optimal price ranges based on the lookback period or manual input. Performance is optimized for smooth updates and analysis of up to 500 bars without lag.
Heatmap is suitable for identifying institutional accumulation and distribution zones, spotting support and resistance levels, understanding market structure, and conducting multi-timeframe volume profile analysis across markets including Forex, indices, and XAUUSD (gold).
Avis clients
5 | 67 % | |
4 | 33 % | |
3 | 0 % | |
2 | 0 % | |
1 | 0 % |


