present
Registe-se e receba 50 $ de desconto na sua primeira compra
Trading product for Grid Visualization 2.0 Indicador Drawdown Monitor, image 1
Grid Visualization 2.0
Indicador
Versão 1.0, Apr 2026
Windows, Mac
Trading product for Grid Visualization 2.0 Indicador Drawdown Monitor, image 2
Trading product for Grid Visualization 2.0 Indicador Drawdown Monitor, image 3
Trading product for Grid Visualization 2.0 Indicador Drawdown Monitor, image 4
33
Vendas
1.01K
Instalações gratuitas

Descrição


Interactive Grid & Martingale Planner (Drag & Drop)


Overview
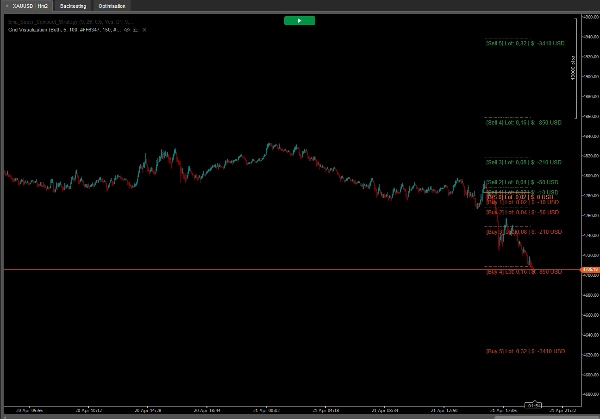
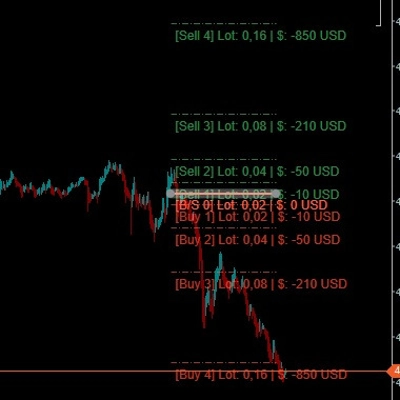
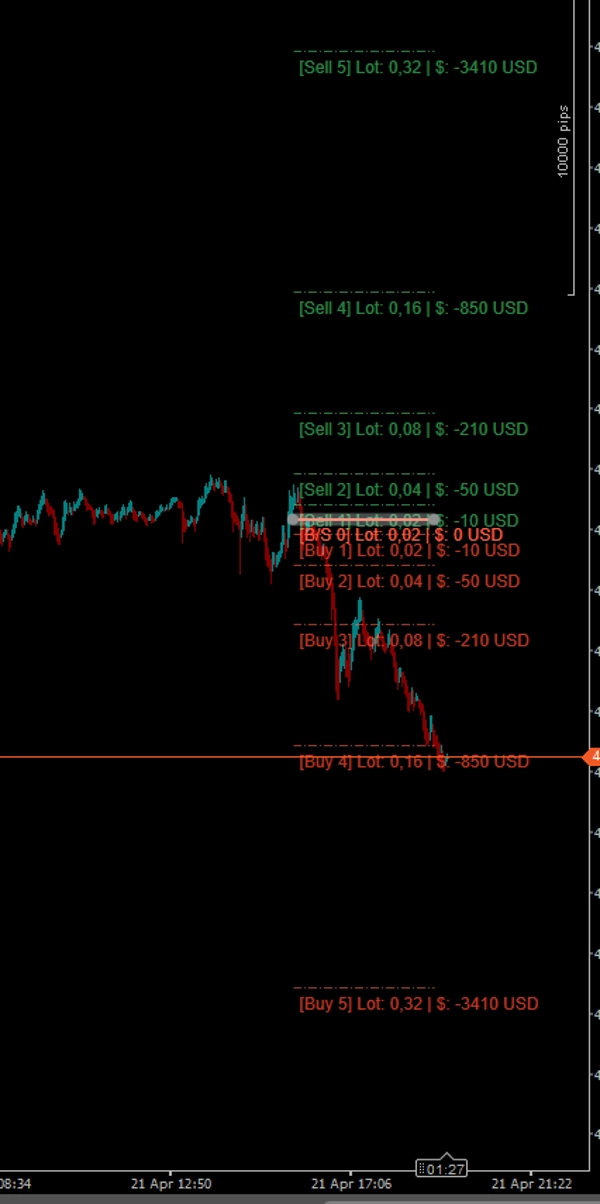
The Interactive Grid Planner is a powerful, free, and fully interactive visualizer for traders who utilize Grid, Recovery, or Martingale strategies. Instead of guessing your future drawdown or calculating position sizes manually, this indicator allows you to plot a potential grid directly on the chart and interact with it in real-time!

It calculates and displays the exact lot size and the cumulative Unrecognized PnL (in your account currency, e.g., $) for every future grid level based on your algorithmic parameters.

🔥 Key Features (The Magic):

  • Point & Click Creation: Hold CTRL and Left-Click anywhere on the chart. The grid will instantly spawn exactly at your mouse cursor's price level.
  • Drag & Drop Real-Time Updates: The main entry line (Level [0]) is fully interactive! Click and drag it up or down across the chart. The entire grid, including all pip distances and PnL calculations, will dynamically recalculate and follow your cursor in real-time!
  • Money-Based Spacing: Forget calculating pips manually. You set the distance based on your account currency (e.g., "Open the next grid level when my loss hits $10"). The indicator calculates the exact pip distance automatically for any asset.
  • Advanced Lot Progression: Choose how your position sizes scale. Supports Arithmetic Addition (e.g., 0.02, 0.04, 0.06) or traditional Multipliers. (Note: By design, the initial entry Level 0 and the first recovery Level 1 share the exact same starting lot size).
  • Custom Aesthetics: Full support for HEX color codes (e.g., #FF6347) or standard color names. It also features a custom Opacity parameter (0-255) to make grid lines transparent, keeping your charts clean.
  • One-Click Cleanup: Hold CTRL and Left-Click again to instantly clear the entire grid from your chart.

How to Use:

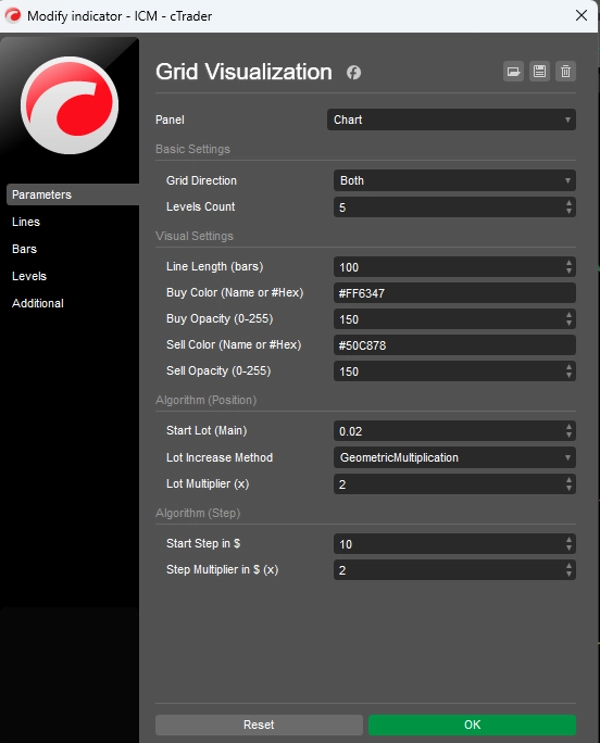
  1. Attach the indicator and set your algorithm rules (Starting Lot, Step value in $, Multipliers).
  2. Hover your mouse over the exact price level where you want to simulate your initial entry.
  3. Hold the CTRL key and Left-Click. The grid will appear.
  4. Grab the solid Main Line (Level 0) with your mouse and drag it around to easily explore different entry scenarios.
  5. To hide the grid, hold CTRL + Left-Click again.

Parameters:

  • Grid Direction: Display Buy levels (downwards), Sell levels (upwards), or Both simultaneously.
  • Visual Settings: Line length in bars, HEX Color inputs, and precise Opacity control.
  • Start Lot & Multiplier: Your base volume and the multiplier applied to subsequent recovery levels.
  • Start Step ($) & Step Multiplier: The monetary distance to the first recovery level, and how much that distance expands on further levels.

Perfect for manual traders planning a grid entry, or algorithmic developers visualizing their EA's logic before coding!


Resumo

Perfil do indicador
Categoria do indicador
Estatísticas
Tipo de resultado
Visualização
Requisitos de dados
Apenas barras

Conversa

Avaliações de clientes

0.0
Avaliações: 0
Avaliações de clientes
Ainda não há avaliações para este produto. Já o experimentou? Seja o primeiro a contar a outras pessoas!

Perguntas frequentes

Drawdown Monitor
Os produtos disponíveis através da cTrader Store, incluindo bots de negociação, indicadores e plugins, são fornecidos por programadores terceiros e são disponibilizados apenas para fins informativos e de acesso técnico. A cTrader Store não é um corretor e não fornece aconselhamento em matéria de investimento, recomendações pessoais ou qualquer garantia de desempenho no futuro.

Mais deste autor

Indicador
AI
Prop
+8
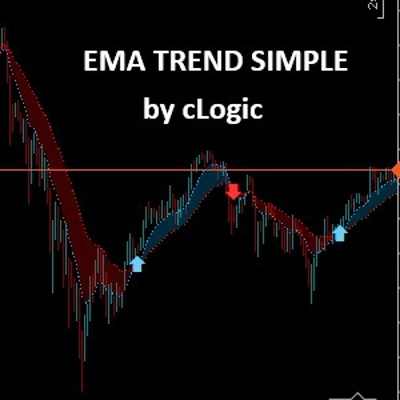
The EMA Trend Simple is a trend-following tool designed for simplicity and visual clarity.
cBot
Prop Firm Fit
Stop Loss (SL) Manager
+1
HTS Strategy Tester - Advanced Multi-Timeframe Trend & Pullback Trading System H1/m1 & H4/m5 WWS 33/144 Start from 100$
90.1%
ROI
2.92
Fator de lucro
Indicador
AI
Grid
+7
Follow The Trend cBot - INDICATOR - displays two Moving Average Bands for cBot or for your own use
Indicador
AI
SMC
+7
The ultimate tool for Price Action and ICT. High, Low and Mid levels for days, weeks Inc. NY Midnight and Custom Range.
Indicador
Key Levels
TP_SL Very useful Risk & Reward Tool. Bring the ultimate TradingView-style Long/Short Position
Indicador
ATR
MACD
+15
MACD Advanced -- It combines the standard MACD logic with a rich set of visual tools
Indicador
ATR
Prop
+13
HCCC MTF (Hurst Cycle Composite Channel), Designed for Semi-Automated Trading, Interactive MTF Dashboard
Indicador
AI
RSI
+7
EMA MTF TREND PRO - Multi-timeframe trend analysis overlay indicator, 6 timeframes - in one table with ADX
Indicador
AI
Prop
+7
EMA Clouds, Multi-Timeframe (MTF) Overlay, Swing High/Low detection, and a smart Dashboard with neutral zone filtering.
Indicador
AI
SMC
+4
Weekly Daily Opening Gaps — NWOG & NDOG Indicator Professional-grade opening gap visualization for institutional traders
Indicador
ATR
Channel
+1
Bollinger Bands Advanced Squeeze & Breakout System, Real-Time On-Chart Dashboard, Auto-Squeeze Detector, Dual-Band Cloud
Logótipo de "RSI Advanced"
Bem avaliado
5.0
(4)
$20
/
$30
Indicador
AI
ATR
+12
The standard Relative Strength Index (RSI), RSI & Signal Cloud, Smart Volatility Filter (ATR), On-Chart Info Dashboard

Também poderá gostar de

Indicador
ATR
Key Levels
It combines the trend-filtering power of Renko charts with the volatility tracking of ATR Bands
Indicador
RSI
XAUUSD
+2
Automatic ZigZag swings with dynamic support & resistance levels, labeling highs/lows for clear trend signals.
Indicador
ADX
ATR
+5
Multi-indicator confluence HUD & real-time backtest engine to detect trend alignment and filter high-probability setups.
Indicador
Forex
Indices
+1
Professional Fair Value Gaps with multitimeframe spot on
Indicador
Signal
Fractal Arrow Buy and Sell Indicator
Indicador
Volume
Key Levels
+1
Session volume profiles from tick volume: POC, value area high and low, and naked POCs extended until touched.
Indicador
Prop
Forex
+4
TSPivotSMC-V2: The Fusion of Classical Pivots & Institutional Liquidity.
Indicador
Forex
Signal
+1
Great signal indicator, works with bollinger bands and heikin ashi candles! one of our latest innovations!
Indicador
RSI
Forex
+4
😎Read the description before purchasing💩
Indicador
AI-assisted
Predictive Monte Carlo Engine Forecast future price paths using institutional-grade statistical models and probability
Indicador
Premium Discount Zones" spots key areas (🟣Premium/🟢Discount) using recent highs/lows & volume..............
Indicador
ATR
BOS
+5
Market structure with BOS and CHoCH, order blocks, and retest buy/sell arrows with entry, stop and two targets
Indicador
AI
ATR
+20
Detects smart money activity using advanced tick volume and price divergence analysis.
Indicador
VWAP
Support & Resistance
Trading.FC$_vwap Algo shows VWAP trends, dynamic support/resistance and deviation bands to spot potential trade entries.
Indicador
Indices
Multi-Timeframe ADX Trend Dots & Arrows
Indicador
ATR
BOS
+5
Opening ranges, dynamic trend channels, and multi-scale breakout/retest analysis for clear intraday chart decisions.
Indicador
Forex
USDJPY
+1
JPYX Indicator with HMA
Indicador
RSI
EURUSD
+2
It identifies areas of market imbalance (Fair Value Gaps or FVGs) and projects them on the chart in a smart way

Preço

33
Vendas
1.01K
Instalações gratuitas