


Deskripsi
IDEA
Volume Profile yang menyesuaikan dengan pergerakan harga tepat yang ditentukan oleh rentang yang dipilih daripada memaksa analisis ke dalam periode yang telah ditentukan sebelumnya.
MASALAH
Sebagian besar alat Volume Profile dibangun berdasarkan periode yang telah ditentukan.
Sesi. Hari. Minggu. Lookback tetap.
Namun pergerakan harga yang ingin Anda pelajari jarang cocok dengan batasan tersebut.
Sebuah kaki tren bisa dimulai di tengah sesi.
Koreksi bisa meliputi beberapa periode.
Pergerakan dari ayunan ke ayunan bisa mulai dan berakhir di mana saja pada grafik.
Masalahnya tidak selalu pada Volume Profile itu sendiri.
Masalahnya adalah membiarkan periode waktu menentukan pergerakan harga mana yang dianalisis.
KONSEP INTI: TENTUKAN RENTANG. BIARKAN PROFIL MENYESUAIKAN DIRI.
Custom Range Volume Profile membalikkan hubungan tersebut.
Alih-alih bertanya:
"Periode mana yang harus dianalisis oleh profil?"
Anda menentukan:
"Pergerakan harga mana yang ingin saya analisis?"
Dua jangkar menentukan rentang.
Indikator mengukur harga tertinggi dan terendah antara dua jangkar tersebut, lalu membangun volume profile di dalam rentang harga itu.
Ini membuat pergerakan harga menjadi referensi utama daripada periode yang telah ditentukan sebelumnya.
Anda menentukan rentang. Profil menyesuaikan diri.
APA YANG DILAKUKANNYA
Tempatkan dua jangkar pada bar yang ingin Anda pelajari.
Indikator secara otomatis membangun Volume Profile untuk rentang tersebut menggunakan timeframe sumber yang dipilih.
Geser salah satu jangkar, dan profil langsung dihitung ulang.
Anda dapat menentukan dan menentukan ulang pergerakan langsung dari grafik tanpa dibatasi oleh batas sesi, lookback tetap, atau periode yang telah ditentukan lainnya.
Gunakan untuk mempelajari:
- Sebuah kaki tren secara keseluruhan
- Koreksi atau konsolidasi
- Pergerakan antara dua titik ayunan
- Impuls spesifik dan retracement-nya
- Pergerakan harga lain yang penting untuk analisis Anda
Profil kemudian menunjukkan di mana volume terkumpul di dalam pergerakan spesifik tersebut.
TIMEFRAME SUMBER OTOMATIS
Rentang yang dipilih dan timeframe yang digunakan untuk menghitung profilnya tidak harus sama.
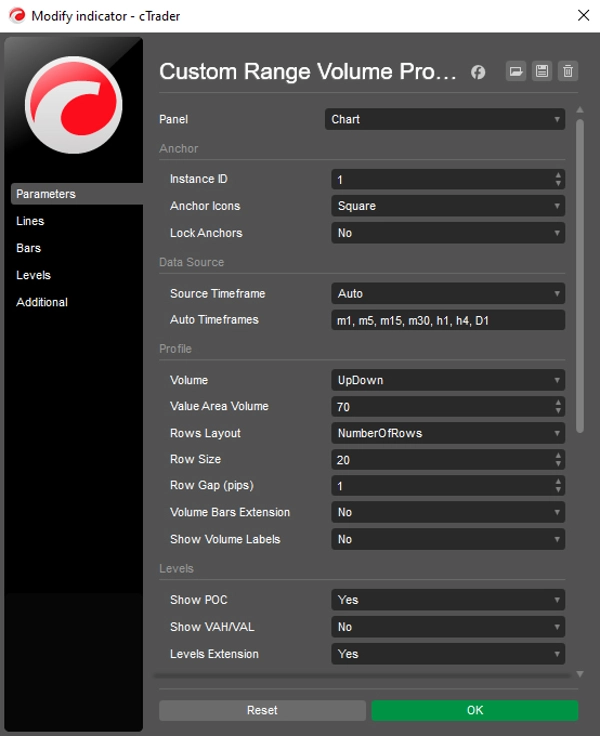
Saat mode Auto diaktifkan, indikator mencari melalui daftar timeframe yang Anda konfigurasi dan memilih timeframe terbaik yang mampu mencakup rentang yang dipilih sambil tetap dalam batas pemrosesan 5.000 bar.
Ini memungkinkan rentang historis yang besar dianalisis menggunakan timeframe sumber yang lebih halus daripada grafik yang Anda lihat, jika tersedia.
Contohnya:
Grafik H4 → rentang yang dipilih multi-hari → timeframe sumber lebih halus seperti M1, M5, atau M15
Anda juga dapat menonaktifkan mode Auto dan menggunakan timeframe grafik secara langsung.
TIGA CARA MEMBACA PROFIL
Pilih bagaimana Anda ingin memeriksa distribusi volume:
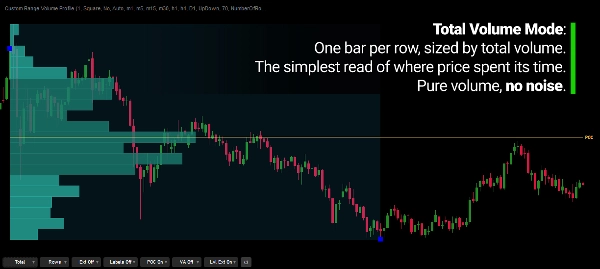
Total
Menampilkan total volume pada setiap baris harga, memudahkan melihat di mana aktivitas terkonsentrasi.
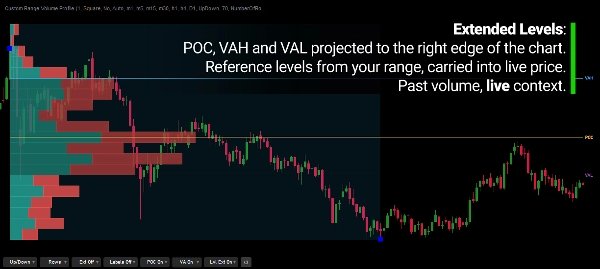
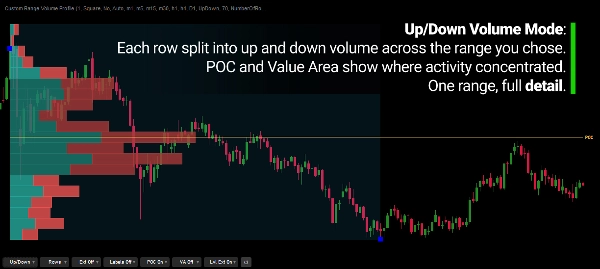
Naik / Turun
Memisahkan volume berdasarkan apakah bar sumber ditutup di atas atau di bawah pembukaannya.
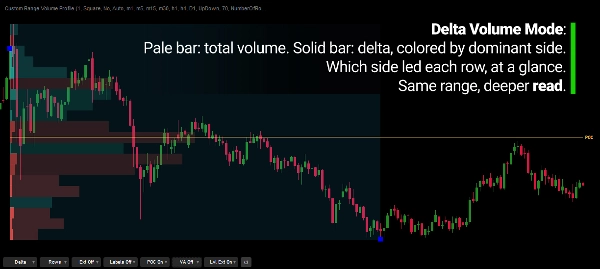
Delta
Menampilkan total volume bersama dengan selisih antara volume naik dan turun.
Mode tampilan dapat diubah langsung dari kontrol di grafik tanpa membuka kembali pengaturan indikator.
LEVEL KUNCI
Profil dapat menampilkan:
- Point of Control (POC) — baris harga dengan volume tertinggi
- Value Area High (VAH)
- Value Area Low (VAL)
- Persentase Value Area yang dapat dikonfigurasi, default 70%
- Perpanjangan level opsional
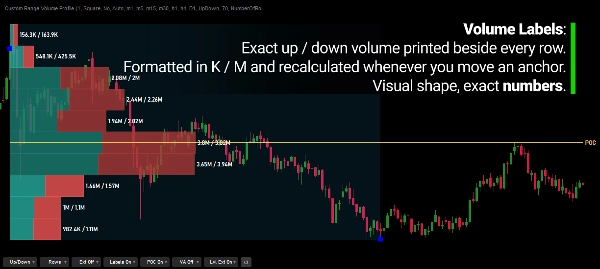
- Label volume
Level-level ini memberikan referensi tambahan untuk memahami di mana aktivitas terkonsentrasi dalam pergerakan yang dipilih.
RENTANG TETAP DI BAWAH KENDALI ANDA
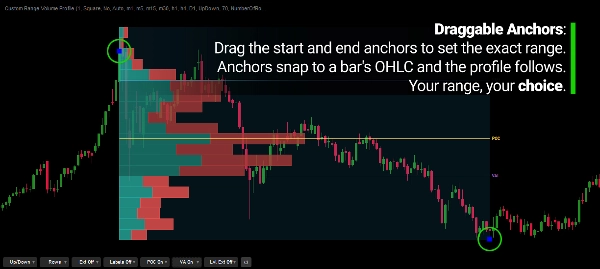
Jangkar dapat dipindahkan langsung di grafik, dikunci untuk mencegah perpindahan tidak sengaja, dan dapat menempel pada:
- Open
- High
- Low
- Close
Ini memberi Anda kontrol tepat atas apa yang termasuk dalam profil.
Ubah titik awal.
Ubah titik akhir.
Ubah pergerakan yang Anda pelajari.
Profil mengikuti rentang.
MULTIPLE PROFILE. REFERENSI MULTIPLE.
Beberapa profil independen dapat ditampilkan pada grafik yang sama.
Setiap profil dapat memiliki rentang dan pengaturannya sendiri, memungkinkan pergerakan harga yang berbeda dianalisis secara bersamaan.
Misalnya, satu profil dapat mewakili sebuah impuls sementara yang lain mencakup koreksinya.
Rentang tetap independen.
RESOLUSI PROFIL YANG FLEKSIBEL
Pilih bagaimana profil membagi harga:
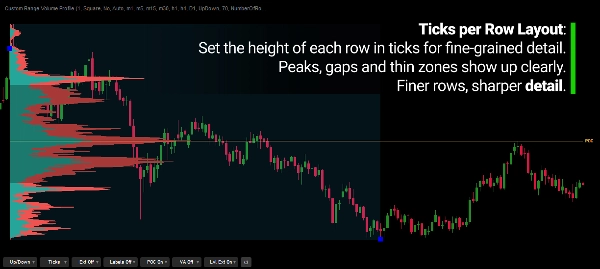
Target Rows
Tentukan jumlah baris harga kira-kira, dengan ukuran tick per baris dipilih secara otomatis untuk mendekati target tersebut.
Ticks Per Row
Tentukan resolusi harga langsung melalui jumlah tick yang ditetapkan untuk setiap baris.
Ini memungkinkan profil dilihat pada tingkat granularitas yang berbeda tergantung pada pergerakan yang dipelajari.
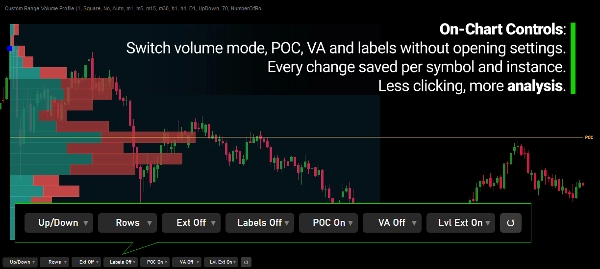
KONTROL DI GRAFIK
Pengaturan yang sering digunakan dapat disesuaikan langsung dari grafik.
Ubah:
- Mode volume
- Tata letak baris
- Perpanjangan
- Label
- Visibilitas POC
- Visibilitas Value Area
tanpa harus membuka kembali pengaturan indikator berulang kali. Bar kontrol dapat ditempatkan di sudut mana pun atau disembunyikan, dan perubahan disimpan per simbol dan per instance.
TAMPILAN YANG DAPAT DISESUAIKAN
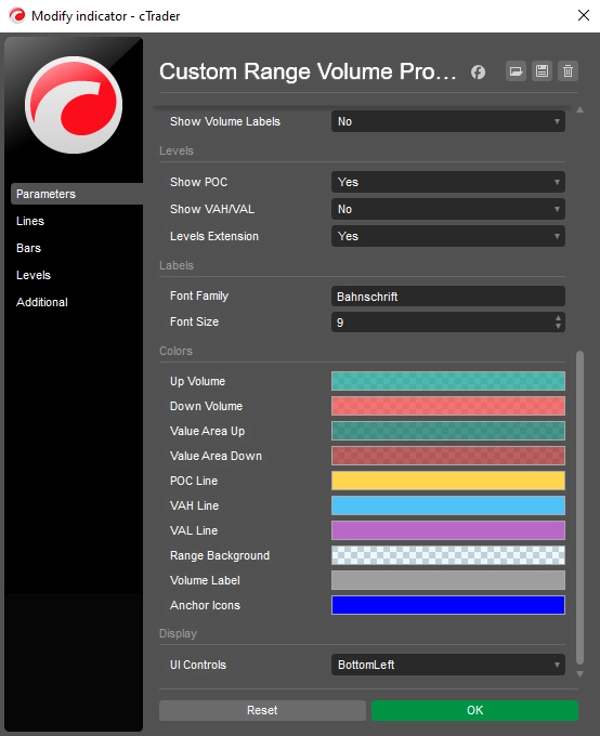
Presentasi visual dapat disesuaikan agar sesuai dengan alur kerja Anda.
Sesuaikan elemen seperti:
- Warna
- Font
- Label
- Perpanjangan
- Parameter tampilan lainnya
Perhitungan dasar tetap independen dari presentasi visual.
MEMBACA PROFIL
Volume Profile menggambarkan di mana aktivitas terkumpul di seluruh harga selama rentang yang dipilih.
Area volume tinggi menunjukkan harga di mana lebih banyak aktivitas terjadi, sementara area tipis menunjukkan harga dengan volume terkumpul yang lebih sedikit.
Bentuk profil dapat memberikan konteks yang berguna:
- Volume terkonsentrasi → aktivitas terkumpul di sekitar area harga tersebut
- Area tipis di antara node yang lebih berat → aktivitas terkumpul relatif lebih sedikit di harga-harga tersebut
- POC dekat salah satu tepi rentang → aktivitas terkonsentrasi ke salah satu sisi pergerakan yang dipilih
Ini adalah pengamatan tentang apa yang sudah terjadi.
Ini bukan prediksi tentang apa yang harus dilakukan harga selanjutnya.
DATA & PERHITUNGAN
Indikator ini menggunakan volume tick yang disediakan oleh feed data broker Anda.
Volume dari setiap bar sumber didistribusikan ke seluruh rentang harga bar tersebut.
Up/Down dan Delta mengklasifikasikan bar sumber berdasarkan pembukaan dan penutupannya.
Oleh karena itu, Delta mewakili volume bar yang bersifat arah, bukan aliran order bid/ask aktual di bursa.
Hasilnya adalah perkiraan distribusi volume yang konsisten dan dapat direproduksi untuk rentang yang Anda pilih.
DIRANCANG UNTUK ANALISIS RENTANG HARGA
Custom Range Volume Profile dirancang untuk mempelajari distribusi volume di dalam pergerakan harga yang ditentukan, bukan secara otomatis memprofilkan periode waktu sembarangan.
Gunakan untuk memeriksa:
- Distribusi volume dalam tren
- Impuls dan koreksi
- Pergerakan dari ayunan ke ayunan
- Area volume tinggi dan rendah
- POC dan Value Area
- Penerimaan harga dan area aktivitas yang lebih tipis
- Distribusi volume berbeda di berbagai pergerakan harga
- Beberapa rentang independen pada grafik yang sama
Indikator tidak menentukan pergerakan mana yang penting.
Anda menentukan rentang. Ini membangun profil.
FITUR UTAMA
- Dua jangkar rentang yang dapat digeser dengan opsi penguncian
- Jangkar menempel ke Open, High, Low, atau Close
- Profil rentang harga khusus
- Pemilihan timeframe sumber otomatis dari daftar timeframe yang dapat dikonfigurasi
- Opsi timeframe sumber manual
- Mode Total / Up-Down / Delta
- Point of Control
- Value Area High / Low
- Persentase Value Area yang dapat dikonfigurasi
- Target Rows atau Ticks Per Row
- Beberapa profil independen
- Kontrol di grafik
- Label volume opsional dan perpanjangan POC / Value Area
- Tampilan visual yang dapat disesuaikan
- Perhitungan berbasis volume tick
---
Perdagangan melibatkan risiko. Indikator ini adalah alat analisis teknikal dan harus digunakan bersama dengan manajemen risiko yang tepat.
Ringkasan
Key features include three volume modes—Total, Up/Down, and Delta—that show different perspectives of volume activity. The indicator identifies the Point of Control (POC), the price level with the highest volume, and the Value Area, which covers a configurable percentage of total volume, with optional display of Value Area High (VAH) and Value Area Low (VAL) levels. Users can customize row layout, volume bar extensions, labels, colors, and on-chart controls for mode switching and display options.
Designed for swing, intraday, structure-based, and discretionary traders, this tool provides a contextual framework to understand where volume concentrated during specific moves, aiding in identifying key support and resistance levels based on volume distribution. Multiple independent profiles can be used simultaneously on the same chart.
Ulasan pelanggan
5 | 100 % | |
4 | 0 % | |
3 | 0 % | |
2 | 0 % | |
1 | 0 % |
Diskusi
Pertanyaan umum





















Harga