present
Зарегистрируйтесь и получите скидку $50 на первую покупку
Trading product for CVD_Per-Bar Delta Индикатор Volume, image 1
CVD_Per-Bar Delta
Индикатор
Версия 1.0, May 2026
Windows, Mac
Trading product for CVD_Per-Bar Delta Индикатор Volume, image 2
Trading product for CVD_Per-Bar Delta Индикатор Volume, image 3
Trading product for CVD_Per-Bar Delta Индикатор Volume, image 4
Trading product for CVD_Per-Bar Delta Индикатор Volume, image 5
Trading product for CVD_Per-Bar Delta Индикатор Volume, image 6
Trading product for CVD_Per-Bar Delta Индикатор Volume, image 7
С 23/04/2026

Описание

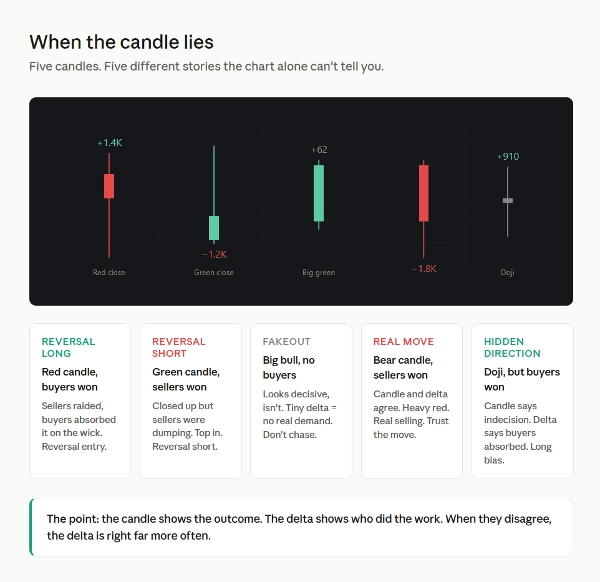
A candle shows you the outcome. It doesn't show you who did the work.

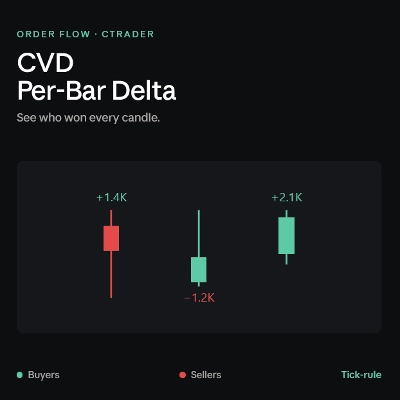
A bullish candle can close green while sellers were dumping into the rally. A bearish candle can close red while buyers absorbed every seller in the bar. A doji can hide a +900 delta of one-sided pressure. Price action alone can't tell you. Volume alone can't tell you. You need to know who won.

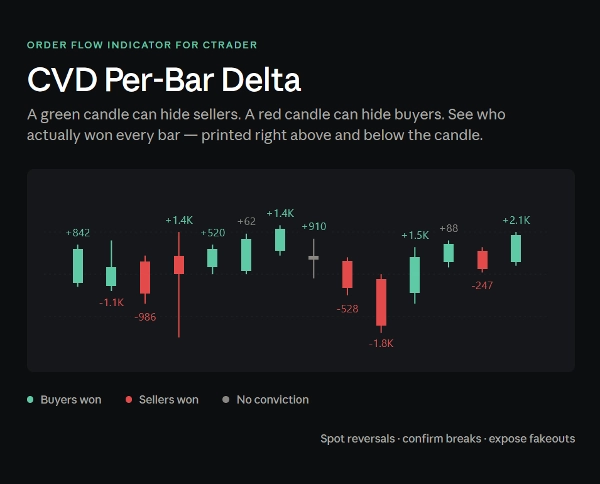
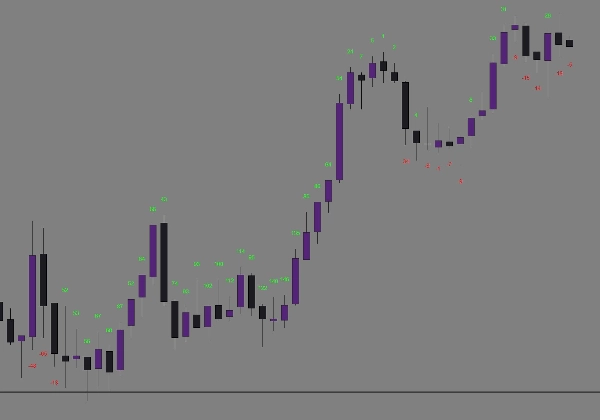
CVD Per-Bar Delta uses tick-rule classification on real cTrader tick data to count buyers vs sellers inside every candle, then prints the result directly on your chart as a colour-coded number. One glance and you know whether bulls or bears were in control — and by how much.

What you see:

  • A green number above buyer-dominated bars
  • A red number below seller-dominated bars
  • Number size scales with conviction — small numbers mean a fair fight, big numbers mean one side dominated

Where it earns its place:

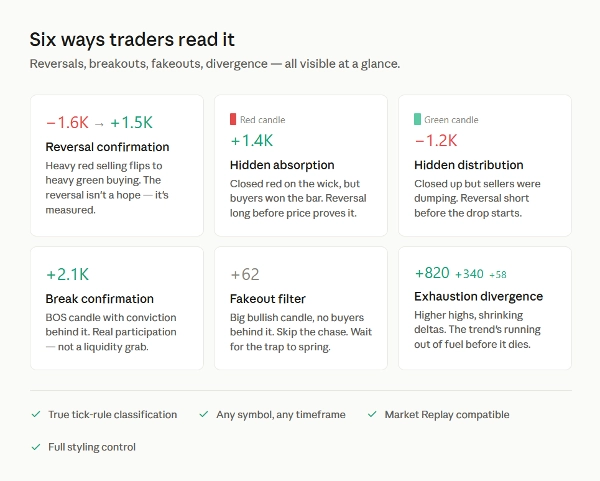
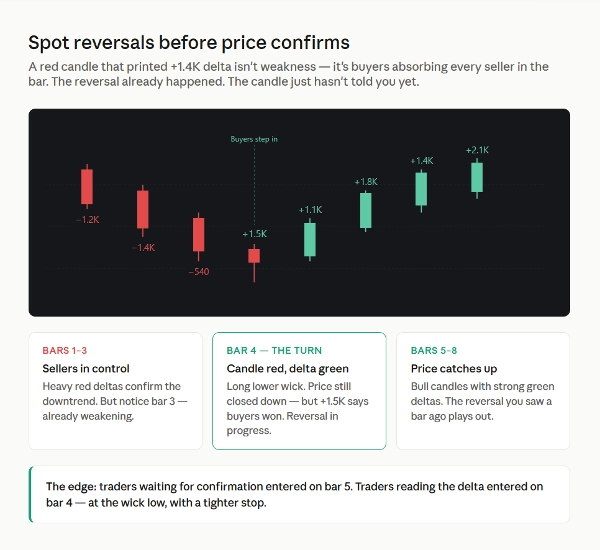
Reversal confirmation. A red candle that printed +1.4K delta isn't weakness — it's buyers absorbing every seller in the bar. The reversal already happened. The candle just hasn't told you yet. Enter at the wick low with a tight stop, while everyone else waits for the next candle to confirm.

Hidden absorption (long setups). Price spikes down into your support zone or order block. Long lower wick. Big green number. Buyers swallowed the raid. That's a high-probability reversal long — and the delta saw it before the candle closed.

Hidden distribution (short setups). Price grinds higher into resistance. Each green candle prints smaller delta than the last, then a green candle closes with a red delta. Buyers exhausted, sellers dumping into the rally. Top in. Short.

Break confirmation. A BOS candle with a strong delta in the break direction is real participation. Same break with a weak or opposite-coloured delta is a liquidity grab dressed as a breakout. Filter the fakeouts before you take them.

Exhaustion divergence. Price keeps making higher highs but the green deltas are getting smaller with each push. Buyers are running out of ammunition. The trend is dying before it dies.

Conviction filter. Two candles look identical on the chart. One has +850 delta. The other has +40. They are not the same candle. Skip the noise. Take the conviction bars.

Built for serious traders:

  • True tick-rule classification using cTrader's tick data — not synthetic OHLC approximation
  • Works on any symbol, any timeframe, any chart
  • Compatible with Market Replay for back-testing your read
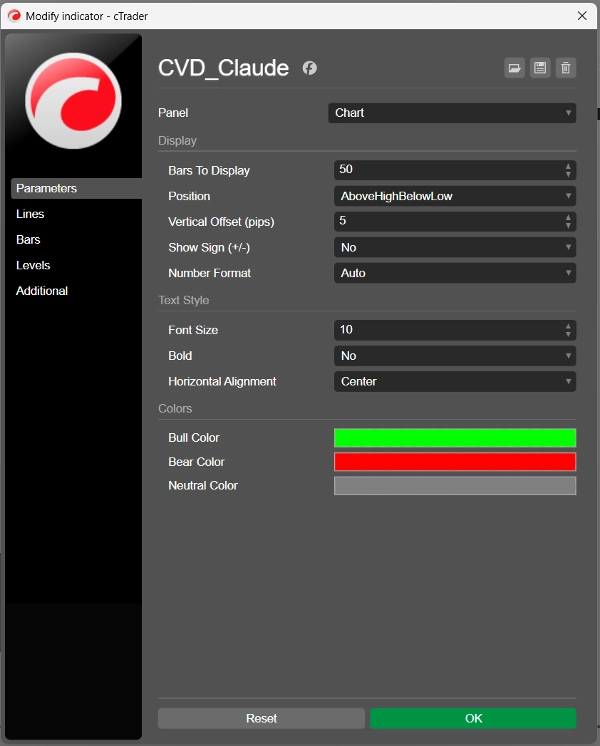
  • Last 50 bars by default, fully configurable — zero clutter

Full styling control:

  • Position — above bar, below bar, or smart (above highs for bull bars, below lows for bear bars)
  • Text — font size 6 to 30, optional bold, alignment options
  • Colours — bull, bear and neutral pickers, match any chart theme
  • Format — raw numbers, K-thousands, or auto-switching
  • Display — adjustable pip offset, sign toggle, bar count

Important: This indicator requires tick data. Live charts use it automatically. For Market Replay, select "Tick data" when starting your replay session.

Pairs especially well with: order block / SMC strategies, reversal trading at key levels, breakout systems, mean-reversion setups, and any methodology that benefits from confirming intent behind a candle.

The chart shows you what happened. The delta shows you why.

Сводка

Профиль индикатора
Категория индикатора
Объем
Тип вывода
Визуализация
Требования к данным
Тиковые данные
Поддерживаемые сигналы
Расхождение

Обсуждение

Отзывы покупателей

0.0
Отзывы: 0
Отзывы покупателей
У этого продукта еще нет отзывов. Уже попробовали его? Поделитесь впечатлениями!

Частые вопросы

Volume
Продукты, доступные в cTrader Store, включая торговых ботов, индикаторы и плагины, предоставляются сторонними разработчиками и доступны исключительно в информационных и технических целях. cTrader Store не является брокером и не предоставляет инвестиционные консультации, персональные рекомендации или какие-либо гарантии будущей доходности.

Вам также может понравиться

Логотип продукта "Vwap Bands"
Высокий рейтинг
4.5
(4)
$19
/
$29
Индикатор
VWAP
Moving Average
Vwap Bands it is highly sought after by professional traders because it includes Standard Deviation Bands
Индикатор
Volume
Key Levels
View tick activity across a selected chart range with Point of Control, Value Area High and Value Area Low.
Индикатор
AI
ATR
+27
Nadaraya-Watson Envelope Indicator
Индикатор
Forex
BTCUSD
+11
Master trends with Smart ADX: MTF Scanner, precise Buy/Sell signals, Divergence & clear Exit targets 🎯
Логотип продукта "ORB v1.1"
Хит
4.0
(4)
$25
Индикатор
Breakout
Opening Range Breakout v1.1 - Visuals + Stats
Индикатор
ATR
BOS
+5
Opening ranges, dynamic trend channels, and multi-scale breakout/retest analysis for clear intraday chart decisions.
Индикатор
SMC
Forex
+7
Simple Smart Money Concepts (SMC)
Индикатор
Forex
BTCUSD
+5
Auto-plots Open, High, and Low of Day/Week/Month/Year. Session candle counter + Round Numbers. Fully customizable
Индикатор
Volume
Key Levels
+5
Volume Profile Pro v2 - A Lightweight and Highly Customizable Side & Range Volume Profile
Индикатор
AI
SMC
+5
Complete ICT Killzones: 5 sessions, easy colors, transparency controls & session info. Professional timing for cTrader.
Индикатор
BOS
CHOCH
+3
Identifies HH, HL, LH, and LL swing points using fractals. Essential for Smart Money Concepts and price action.
Логотип продукта "Axiom Matrix"
Новинка
4.6
(3)
$29
/
$39
Индикатор
Volume
Support & Resistance
Compare up to 27 symbols across eight timeframes with seven analysis engines and an interactive cTrader dashboard.
Индикатор
[Hamster-Coder] Pivot Points (Multi Time Frame)
Индикатор
Prop
Forex
+11
😎Read the description before purchasing💩
Индикатор
ATR
Forex
+11
Elliott Wave 2 indicator with Markov probability analysis and a confidence score to assess Wave 3 continuation quality.
Индикатор
Forex
BTCUSD
+9
synchronize scroll position and zoom levels across multiple charts. Perfect for multi-timeframe analysis
Логотип продукта "Inside Candle"
Высокий рейтинг
4.5
(4)
$19
/
$20
Индикатор
ATR
RSI
+16
Highlight market consolidation zones instantly with this Inside Candle indicator — precise, clean, and powerful.
Индикатор
AI
Forex
+5
Whale Hunting Indicator

Цена

С 23/04/2026