


Описание
Что это делает
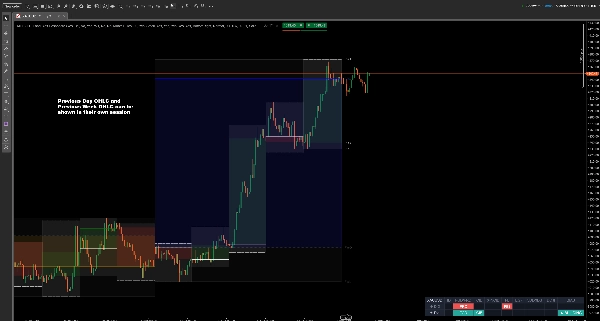
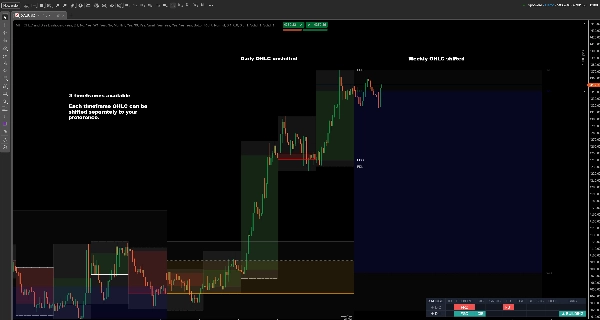
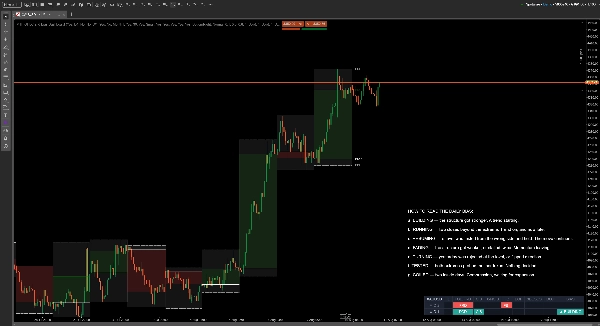
ПАНЕЛЬ OHLC И BIAS НА НЕСКОЛЬКИХ ТАЙМФРЕЙМАХ — это индикатор ценового действия для cTrader, работающий на нескольких таймфреймах. Он отображает уровни OHLC — открытие, максимум, минимум и закрытие — за предыдущий день, предыдущую неделю и предыдущий месяц на вашем графике, а также добавляет панель, которая показывает, что фактически происходило с ценой на этих уровнях за последние два завершённых дня.
Максимум и минимум предыдущего дня (PDH и PDL), дневное открытие, максимум и минимум недели: это уровни поддержки и сопротивления более высокого таймфрейма, с которыми уже работают большинство внутридневных и свинг-трейдеров. Обычно они каждый день визуально сравнивают их — закрылся ли вчера выше, чем позавчера? Пробила ли цена максимум предыдущего дня и неудачно? Нарастает ли движение или исчерпывает потенциал? Этот индикатор отвечает на эти вопросы прямо на графике, в одной строке.
Уровни OHLC на нескольких таймфреймах
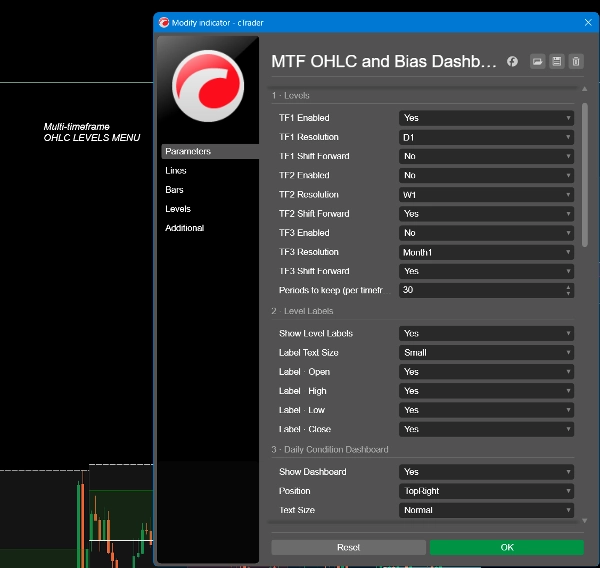
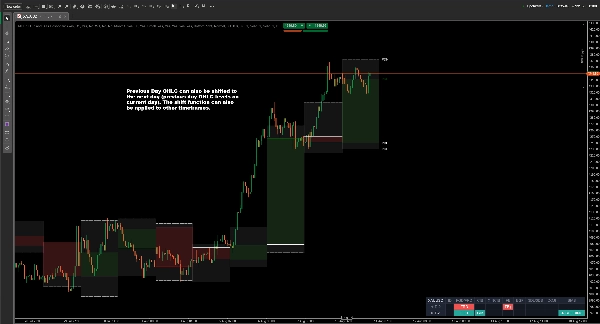
До трёх таймфреймов одновременно — дневной, недельный, месячный или любой выбранный вами интервал. Каждый отображает своё открытие, максимум, минимум и закрытие с опциональным затенённым телом и полосой от максимума до минимума. Уровни можно сдвигать вперёд, чтобы ссылка текущего периода располагалась перед ценой, а не позади неё, и вы можете хранить до 70 исторических периодов на графике.
Каждая линия имеет свой цвет, толщину и стиль, поэтому уровень поддержки на недельном таймфрейме никогда не перепутаешь с дневным.
Панель состояния за день
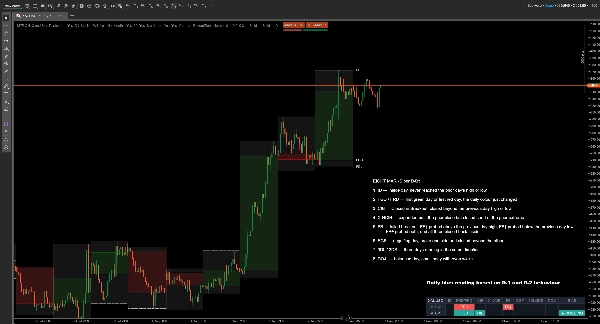
Панель оценивает последние два завершённых дневных свечи — D-1 (вчера) и D-2 (позавчера) — каждую относительно предыдущего дня.
Девять отметок за день:
- ID — внутренняя свеча, не достигла максимума или минимума предыдущего дня
- FGD / FRD — первый зелёный или первый красный день, цвет дневной свечи только что изменился (Зелёный — бычий день, Красный — медвежий день)
- CIB — закрытие в пробое, закрытие за пределами максимума или минимума предыдущего дня
- X-NCIB — расширение за пределы предыдущего закрытия, но закрытие внутри предыдущего экстрема (Expand Not Closed In Breakout = X-NCIB)
- FB — неудачный пробой: FB↑ пробила выше максимума предыдущего дня, FB↓ пробила ниже минимума предыдущего дня, FB± пробила оба, и все три закрылись обратно внутри
- EGF — поглощение, пробой с одной стороны и закрытие за другой
- 3DL / 3DS — три дня подряд в одном направлении (3 дня роста = 3DL / 3 дня падения = 3DS)
- DOJI — сбалансированный день, маленькое тело с равными тенями
- BIAS — оценка, объясненная ниже
Как читать дневной BIAS
BIAS — это часть, которая экономит вам работу. Каждый день сводится к одному состоянию, и BIAS формируется из движения между D-2 и D-1 — а не только из вчерашнего дня. Одна и та же отметка может означать разное в зависимости от того, что было до неё, и именно это однодневная панель не может показать.
- BUILDING — структура укрепляется. Начинается тренд.
- RUNNING — два закрытия за пределами экстремума. Тренд продолжается, но уже поздно.
- RESUMING — уровень был протестирован с неправильной стороны и удержался. Движение продолжается.
- FADING — структура ослабевает или дважды останавливается. Уходит импульс.
- TURNING — вчерашний день был отвергнут на уровне или изменил направление.
- TESTED — оба экстрема были проверены, ни один не взят. Ничего не решено.
- COILED — два внутренних дня. Сжатие, ожидание расширения.
Стрелка и цвет показывают направление: зелёная вверх — бычье, красная вниз — медвежье, нейтральный серый — когда направления нет.
Обе строки с деталями остаются видимыми над BIAS, чтобы вы всегда могли видеть, почему он показывает именно такой результат, а не просто доверять «чёрному ящику».
Типичное использование
Откройте график утром, прочитайте BIAS и узнайте до начала сессии, ожидаете ли вы продолжения, ослабления или флета. Затем торгуйте по своим стратегиям, опираясь на отображённые уровни — максимум и минимум предыдущего дня, дневное открытие, недельные экстремумы.
Подходит для работы с диапазоном открытия, торговли неудачными пробоями и стратегий продолжения от дня к дню. Полезен для форекс, индексов, металлов и криптовалют.
Настройки
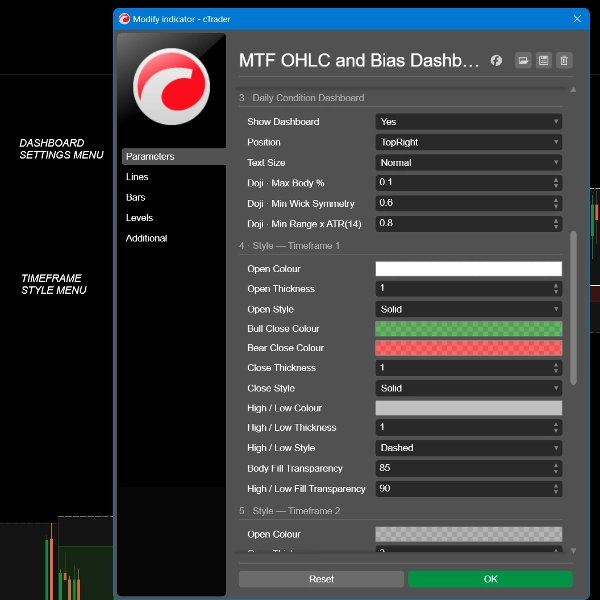
- Три независимых слота таймфреймов, каждый с собственным разрешением, переключателем сдвига вперёд и полным управлением цветом, толщиной и стилем
- Количество исторических периодов для хранения, до 70
- Метки уровней включены или выключены для каждого типа линии, с регулируемым размером текста
- Панель включена или выключена, пять позиций на экране, четыре размера текста
- Чувствительность доджи: максимальный процент тела, минимальная симметрия теней, минимальный диапазон относительно 14-дневного среднего
******************************************************
Для кого это
Внутридневные и свинг-трейдеры, которые уже работают с уровнями предыдущего дня и предыдущей недели. Предполагается, что вы знаете, что такое максимум предыдущего дня и почему он важен. Если эти уровни не входят в вашу торговую систему, этот индикатор не научит вас их использовать.
Чего он не делает
Чёткое понимание этого сэкономит нам обоим время позже:
- Он не даёт сигналов на покупку или продажу, и не указывает цены входа или выхода
- Он не размещает ордера и не имеет доступа к вашему счёту — индикатор работает без прав доступа
- У него нет оповещений или уведомлений
- Он ничего не предсказывает. Каждая отметка описывает свечи, которые уже закрылись
- Он не перерисовывается. Панель читает только завершённые дневные свечи, поэтому показания не меняются задним числом
- Это не стратегия. BIAS описывает структуру; он не рекомендует сделки
********************************************************
Что стоит знать
Панели требуется минимум четыре завершённых дневных свечи, поэтому у недавно добавленного символа будут отображаться тире, пока не накопится достаточная история.
Дневные свечи начинаются по времени сервера вашего брокера. Два брокера на одном инструменте могут отсекать день в разное время, что означает, что один и тот же символ может по-разному отображаться на двух платформах. Это свойство данных, а не ошибка индикатора.
Выше дневного таймфрейма панель не может читать дневные данные и показывает предупреждение TF > D. Уровни при этом всё равно отображаются.
Торговля связана с риском. Прошлые результаты не гарантируют будущих.
Сводка
A central feature is the two-day price action bias dashboard, which analyzes the last two completed daily candles relative to their preceding days. It categorizes daily price behavior into nine distinct patterns (e.g., inside day, first green/red day, failed breakout, engulfing day) and summarizes the overall bias into states such as building, running, fading, or turning. Directional bias is indicated with colored arrows (green for bullish, red for bearish, grey for neutral), helping traders quickly assess market structure without guesswork.
Designed for intraday and swing traders familiar with previous day and week levels, the indicator does not provide trade signals, alerts, or order execution. It is suitable for forex, indices, metals, and cryptocurrencies, aiding strategies like opening-range, failed-breakout, and continuation trading by clearly marking key levels and daily price action context.
Обсуждение
Отзывы покупателей
Частые вопросы
Больше от этого автора




















Цена