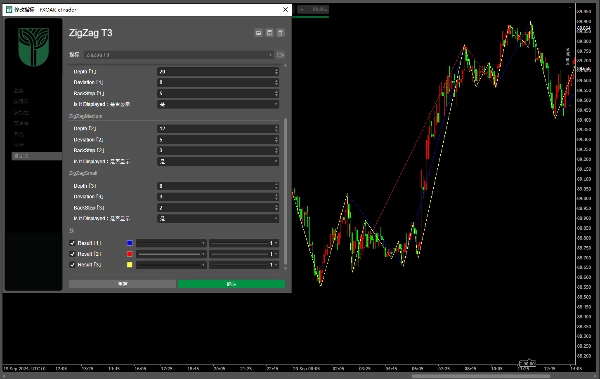
Логотип продукта "ZigZag T3"
ZigZag T3
0.0
03/09/2025
21
Desktop

Three ZigZag lines

Can close or open any one or more

Больше от этого автора
Zigzag T3
Three ZigZag lines
zh-cn Variety Period clock panel(multilanguage)
This indicator can be used to: change color, shape size, position, change font, increase or decrease, and other function
zh-cn Variety Period time panel(multilanguage)
This indicator can be used to: change color, shape size, position, change font, increase or decrease, and other function
RSI T3 Overbought and oversold areas
Three parameter RSI
Ten Thousand Functions Bands Cloud(First Edition)
A metric that can set 1 to 3 groups of Bollinger Bands
Вам также может понравиться
IR Ichimoku Macd
this indicaotr show distance between Tenkan to Kijun, Close to Kijun and Close to Tenkan 
VWAP_MTF
📊 VWAP with MTF & Dynamic Deviation Bands
LT_SmartSwings
Detects swing highs/lows, structure, breakouts, trend lines, and fibs — great for price action trading.
VegaXLR - Moving Average Alerts
A powerful cTrader indicator with customizable Moving Average alerts, notifications, and automated trading actions.
MA-RSI HTF Confirmation
MA-RSI HTF Confirmation: Eliminate false signals and trade with confidence!
E7 BlackScholes Model
Option pricing using the BlackScholes model and the Math.Numerics packages
Индикатор
breakout
btcusd
supertrend
+5
Supertrend
💹 Define a price channel 📈 and determine trend direction (bullish 🟢 or bearish 🔴).
Blocks Liquidity MGC
BlocksLiquidity Indicator Analysis!
RT Chandelier Exit
Optimize exits with Chandelier Exit! Visualize stop-loss points dynamically for improved trading precision and safety.
Индикатор
breakout
commodities
xauusd
CursorByte.SupportResistance v3
Draws support and resistance on all pairs.
Time Marker
CaptraTimeMarker: Marks key trading hours with lines & labels, plus daily separators for cTrader. Customizable & precise
VolumeColorBar
Color Volume Bars – Visualize Market Strength Instantly
Индикатор
breakout
btcusd
supertrend
+4
ICT Power of 3
🎯 Auto-plots key zones (Accumulation, Manipulation, Distribution) . Reveals institutional traps & trends.
Fx4U.Multi Trend Line Indicator
Allow trader to draw multi trendlines in different timeframes on one chart,Give trader an overview of the current market
Volume Weighted Average Price
VWAP is a powerful tool for intraday traders
Vishal Volume Profile v2.0
Volume Profile plots traded volume at each price level, highlighting high activity zones of precise support & resistance
RangeBoxFibonacci
With this Fibonacci retracement indicator, traders have full control over the retracement levels displayed on the chart.