
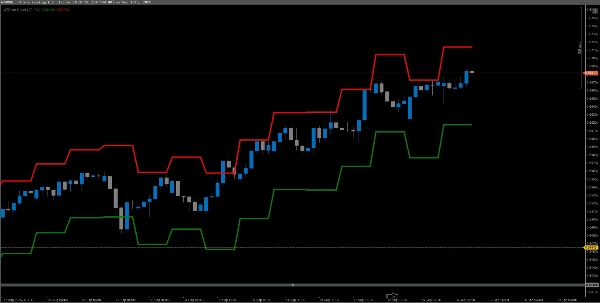
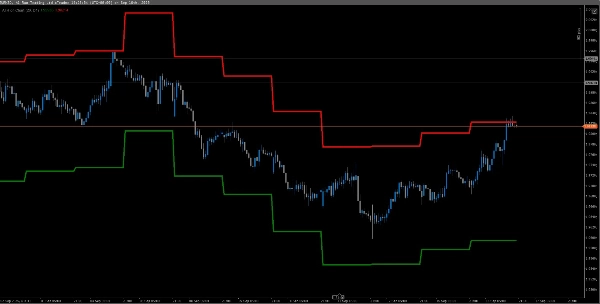
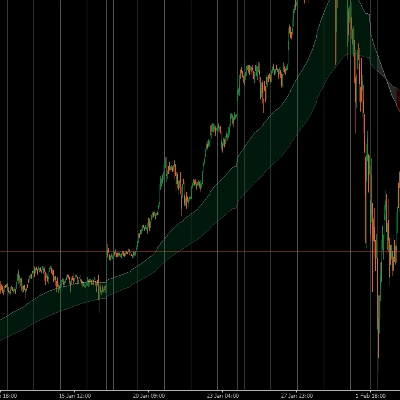
ATR on Chart
Gösterge
250 i̇ndirmeler
Sürüm 1.0, Sep 2025
Windows, Mac
Açıklama
Ortalama gerçek aralığı gösterir. ATR'yi kolay görselleştirme için grafikte çizer, varsayılan zaman dilimi Günlüktür ancak bunu değiştirebilirsiniz.
Özet
Gösterge profili
Müşteri değerlendirmeleri
0.0
Değerlendirmeler: 0
Müşteri değerlendirmeleri
Bu ürün için henüz bir değerlendirme yok. Ürünü denediniz mi? O zaman ona dair görüşlerini paylaşan ilk kişi olun!
Tartışma
SSS
BTCUSD
Forex
Signal
Indices
EURUSD
Commodities
GBPUSD
Crypto
XAUUSD
ATR
USDJPY
cTrader Store üzerinden erişilebilen işlem botları, göstergeler ve eklentiler gibi ürünler, üçüncü taraf sağlayıcılar tarafından sağlanır ve yalnızca bilgilendirme ve teknik erişim amaçlarıyla sunulur. cTrader Store bir broker değildir ve yatırım tavsiyesi, kişisel öneriler vermez veya gelecekteki performansı garanti etmez.


Fiyat
Başlangıç 11/09/2025
250
Ücretsiz yüklemeler