คำอธิบาย
PFO Price Flow Oscillator เป็นเครื่องมือวิเคราะห์ทางเทคนิคที่ออกแบบมาเพื่อให้ผู้ซื้อขายได้รับมุมมองที่มีโครงสร้างเกี่ยวกับโมเมนตัมและความผันผวนของตลาด มันรวมปัจจัยตลาดหลายอย่างเข้าไว้ในออสซิลเลเตอร์ที่ปรับมาตรฐานเดียว ทำให้ผู้ใช้สามารถตีความการเคลื่อนไหวของราคาได้ชัดเจนขึ้นในสภาวะต่างๆ ตัวบ่งชี้นี้ใช้งานได้ฟรีและสามารถนำไปใช้กับ Forex สินค้าโภคภัณฑ์ ดัชนี และสินทรัพย์อื่นๆ ได้
วิธีการทำงาน
ออสซิลเลเตอร์ PFO คำนวณค่าที่ปรับมาตรฐาน (0–100) โดยอิงจาก:
ATR (Average True Range): ปรับขนาดการอ่านให้สอดคล้องกับความผันผวนของตลาด
ค่าเฉลี่ยเคลื่อนที่ (EMA/SMA): ให้เส้นฐานแนวโน้มสำหรับการเปรียบเทียบโมเมนตัม
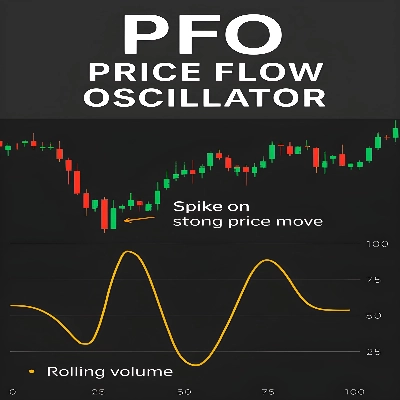
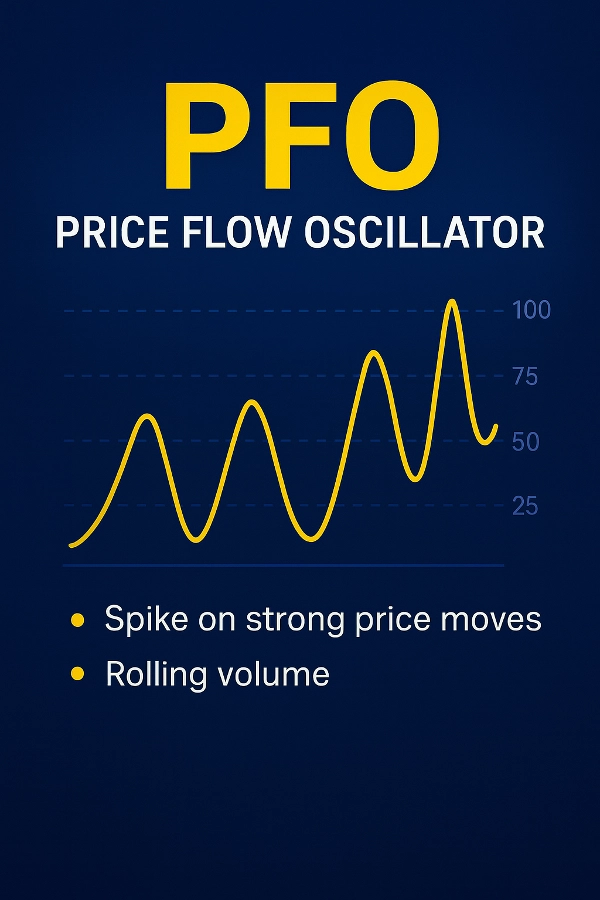
การวิเคราะห์ปริมาณ: เปรียบเทียบกิจกรรมปัจจุบันกับค่าเฉลี่ยเคลื่อนที่เพื่อเน้นการเคลื่อนไหวที่แข็งแกร่งขึ้น
ปัจจัยการเคลื่อนไหวของราคา:
ขนาดตัวเทียบกับช่วงราคา (ความแข็งแกร่งของแท่งเทียน)
การวิเคราะห์ไส้เทียน (แรงกดดันซื้อ/ขาย)
แนวโน้มทิศทาง (การเคลื่อนไหวขาขึ้นกับขาลง)
โมเมนตัมเทียบกับ ATR: วัดการเบี่ยงเบนจากแนวโน้มเมื่อเทียบกับความผันผวน
การถ่วงน้ำหนักการเคลื่อนไหวของราคา: เน้นการเปลี่ยนแปลงที่สำคัญระหว่างแท่งเทียน
การปรับความเรียบและการปรับมาตรฐาน: กรองเสียงรบกวนและปรับผลลัพธ์ให้อยู่ในมาตราส่วน 0–100
การอ่านออสซิลเลเตอร์
เหนือ 75: บ่งชี้สภาวะขาขึ้นที่แข็งแกร่งขึ้น
ต่ำกว่า 25: บ่งชี้สภาวะขาลงที่แข็งแกร่งขึ้น
ประมาณ 50: แสดงถึงพฤติกรรมตลาดที่เป็นกลางหรือกำลังรวมตัว
คุณสมบัติหลัก
แนวทางหลายปัจจัย: รวมความผันผวน แนวโน้ม ปริมาณ และการเคลื่อนไหวของราคา
ค่าที่ปรับความเรียบเพื่อความชัดเจนและลดเสียงรบกวน
การปรับขนาดแบบปรับตัวที่ปรับให้เข้ากับสภาวะตลาดที่แตกต่างกัน
ใช้งานได้กับหลายประเภทสินทรัพย์และกรอบเวลาต่างๆ
ข้อจำกัดความรับผิดชอบ: ตัวบ่งชี้นี้มีวัตถุประสงค์เพื่อการวิเคราะห์ทางเทคนิคเท่านั้น ไม่ได้ทำนายผลการดำเนินงานในอนาคตหรือรับประกันผลลัพธ์การซื้อขาย ผู้ใช้ควรรวมกับการวิเคราะห์และการบริหารความเสี่ยงของตนเอง
สรุป
รีวิวจากลูกค้า
5 | 0 % | |
4 | 100 % | |
3 | 0 % | |
2 | 0 % | |
1 | 0 % |


