
설명
BullBear Dynamics — cTrader용 추세 및 모멘텀 지표
BullBear Dynamics는 cTrader 플랫폼을 위한 견고하고 변동성 인지 지표로, 트레이더가 시장에서 강세와 약세 모멘텀 간의 균형을 감지하고 해석하는 데 도움을 주도록 설계되었습니다. 이동평균, ATR 정규화 및 동적 임계값을 결합하여 추세 평가를 위한 정확하고 시각적으로 직관적인 도구를 제공합니다.
방법론 및 내부 논리
이 지표는 두 개의 지수 이동평균(EMA)을 계산합니다: 단기 EMA와 장기 EMA.
그 다음 이 EMA들 간의 차이를 구하고 이를 평균 실제 범위(ATR)로 나눕니다. 이 정규화는 현재 시장 변동성에 따라 모멘텀 신호를 조정하는 데 도움을 줍니다.
신호선 — 정규화된 값에 적용된 EMA — 은 노이즈를 걸러내고 작은 변동을 부드럽게 만듭니다.
약한 움직임과 강한 움직임을 구분하기 위해, 이 도구는 되돌아보는 기간 동안의 롤링 표준편차(StdDev)를 계산하고 이를 계수와 곱하여 상한 및 하한 임계값을 정의합니다.
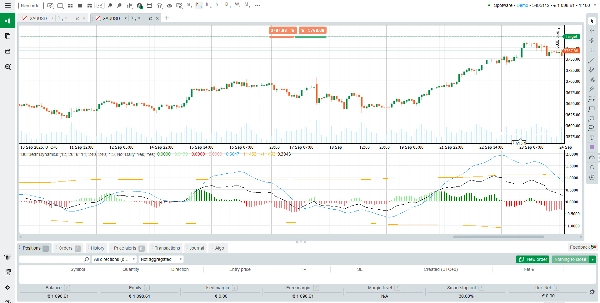
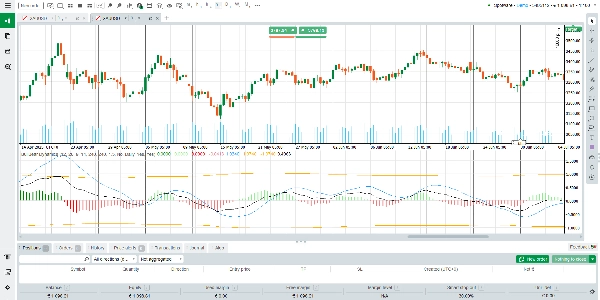
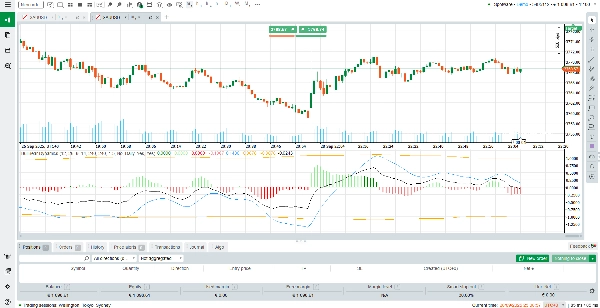
최종 출력은 히스토그램(다중 색상 상태)과 신호선 및 임계값 경계로 시각화됩니다.
출력 읽기 및 해석 방법
히스토그램 막대 (녹색 / 빨간색):
• 녹색은 강세 모멘텀을 나타내고, 빨간색은 약세 모멘텀을 나타냅니다.
• 강한 색상(더 밝거나 진한)은 히스토그램이 임계값을 초과했음을 의미하며, 이는 강한 움직임을 암시합니다.
• 약한 색상은 히스토그램이 임계값 경계 내에 머무름을 의미하며, 이는 약한 모멘텀 또는 노이즈를 암시합니다.
신호선:
• 기준선 역할을 합니다.
• 히스토그램이 신호선을 상향 돌파하면 강세 모멘텀 강화 가능성을 나타냅니다.
• 하향 돌파하면 약세 모멘텀 강화 가능성을 나타냅니다.
임계값 선 (상한 및 하한):
• 이 점선들은 중요 구역을 정의합니다.
• 히스토그램 막대가 임계값을 넘어가면 강력하고 신뢰도 높은 모멘텀 움직임을 나타냅니다.
• 임계값 내에 머무르는 막대는 범위 또는 우유부단함을 시사하며, 신호 신뢰도가 낮습니다.
시나리오 및 판독:
강세 모멘텀 — 신호선 위의 녹색 막대, 가능하면 상한 임계값도 돌파.
약세 모멘텀 — 신호선 아래의 빨간 막대, 가능하면 하한 임계값도 돌파.
중립 / 횡보 — 막대가 임계값 내에서 진동하며, 색상이 번갈아 나타나고 진폭이 작음.
모멘텀 전환 또는 반전 — 히스토그램이 신호선을 교차하고 색상이 변하며, 임계값도 돌파하면 신뢰도가 더 높음.
사용 제안 및 모범 사례
BullBear Dynamics를 다른 도구(추세 필터, 지지/저항, 패턴 분석)와 함께 사용하여 확인하세요.
히스토그램 막대가 임계값 내에 머무르는 저변동성 기간에는 신호 해석에 주의하세요.
히스토그램이 신호선을 교차하고 임계값을 돌파하는 신호를 우선시하세요.
낮은 시간대 신호에 대응하기 전에 높은 시간대에서 방향성 정렬을 확인하세요.
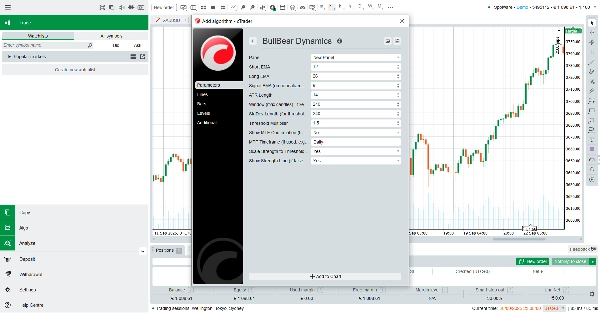
시장(외환, 지수, 원자재, 암호화폐)에 맞게 매개변수(EMA 길이, 임계값 배수, StdDev 창)를 조정하세요.
주요 특징 및 하이라이트
변동성 적응 정규화 — 모멘텀이 ATR로 스케일링되어 다양한 시장 환경에서 신호 신뢰도가 높아집니다.
동적 임계값 — 롤링 표준편차에서 생성되어 현재 시장 상황에 맞게 조정되며, 잘못된 돌파를 줄이는 데 도움을 줍니다.
명확한 다중 색상 히스토그램 — 강한 모멘텀과 약한 모멘텀, 강세와 약세를 시각적으로 구분합니다.
광범위한 호환성 — cTrader가 지원하는 모든 상품과 시간대에서 작동합니다.
무료 사용 가능 — 비용 없이 제공되며, 구독 없이 고급 지표 기능을 원하는 트레이더에게 이상적입니다.
요약
The output is displayed as a multi-color histogram with green bars indicating bullish momentum and red bars indicating bearish momentum. The intensity of the colors reflects the strength of the momentum relative to dynamically calculated upper and lower thresholds. The signal line serves as a baseline to identify potential momentum shifts when the histogram crosses it. Threshold lines mark zones of significant momentum moves, with bars crossing these lines signaling stronger trends.
BullBear Dynamics supports all instruments and timeframes available on cTrader, including Forex, commodities, indices, and cryptocurrencies. It is recommended to use this indicator alongside other analysis tools for confirmation and to adjust its parameters to fit different market conditions and trading styles such as scalping.
고객 리뷰
5 | 100 % | |
4 | 0 % | |
3 | 0 % | |
2 | 0 % | |
1 | 0 % |


